Free Access
Fig. 6
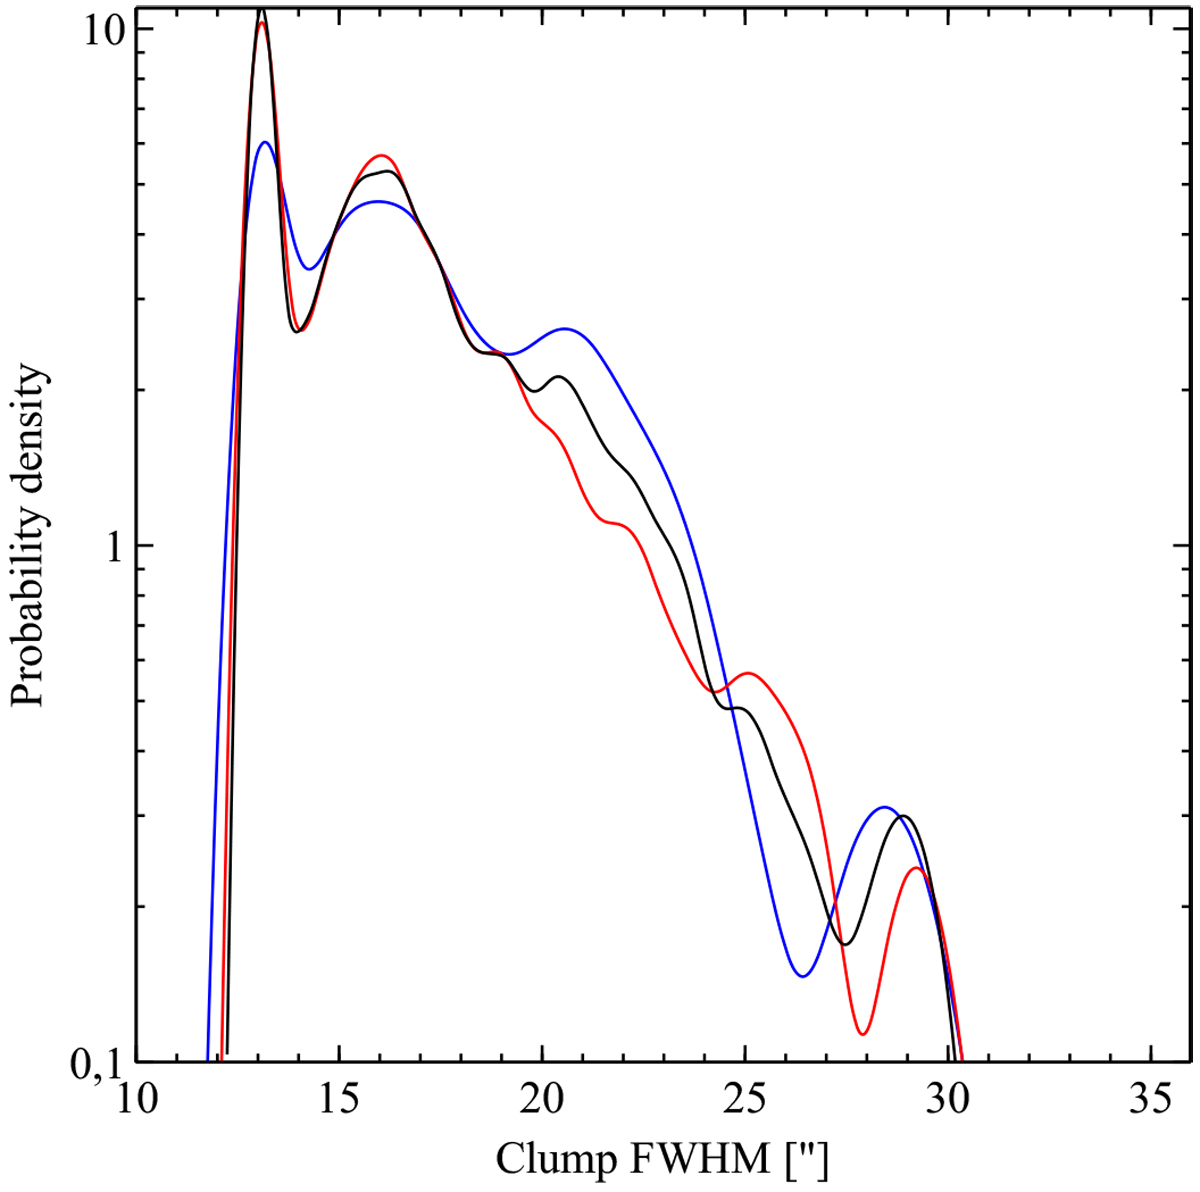
Distribution of core sizes for all 1221 cores (uncorrected for beam; black solid line); the red curve indicates the active region and the blue one the more quiescent part.
Current usage metrics show cumulative count of Article Views (full-text article views including HTML views, PDF and ePub downloads, according to the available data) and Abstracts Views on Vision4Press platform.
Data correspond to usage on the plateform after 2015. The current usage metrics is available 48-96 hours after online publication and is updated daily on week days.
Initial download of the metrics may take a while.