Fig. 16
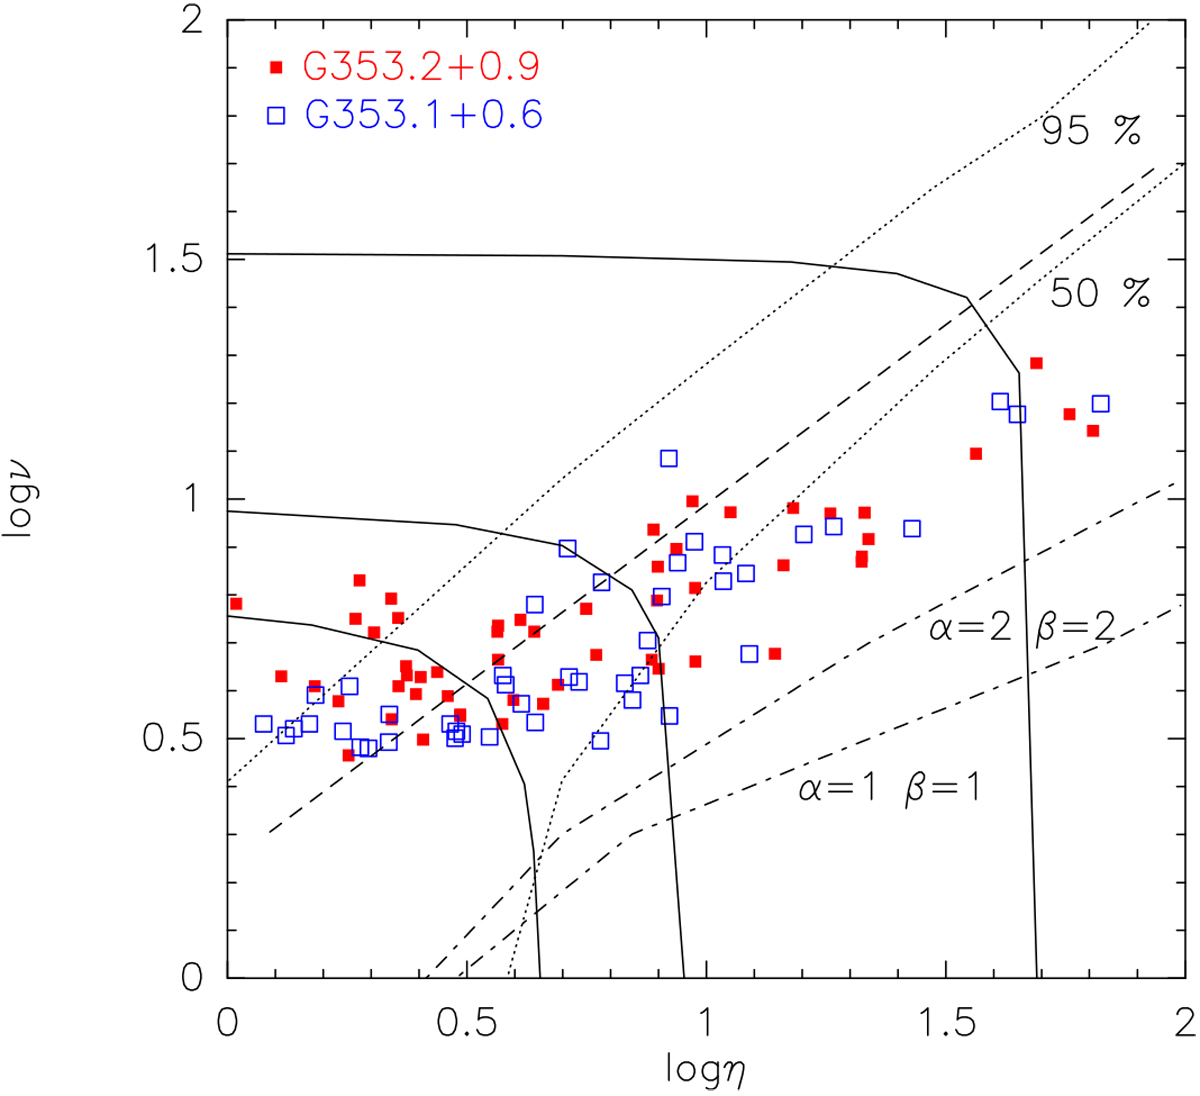
η-ν (see text) plot for the cores associated with the PDRs around the HII regions G353.2+0.9 (filled red squares) and G353.1+0.6 (open blue squares). The dash dotted lines mark the critical densities for turbulent cores for different values of the non-thermal to thermal pressure ratio (α) and the magnetic to thermal pressure ratio (β), and a frozen magnetic field. The solid lines mark the evolution of the column density ratio η against the parameter ν (which increases with increasing G0) for pre-existing cores embedded in an interclump medium. The dotted lines indicate the fraction of mass lost by such cores due to photoevaporation when exposed to a steadily increasing G0. The dashed line marks the critical density for such cores, i. e. the column density of a core that would be completely photoevaporated by a FUV field ν.
Current usage metrics show cumulative count of Article Views (full-text article views including HTML views, PDF and ePub downloads, according to the available data) and Abstracts Views on Vision4Press platform.
Data correspond to usage on the plateform after 2015. The current usage metrics is available 48-96 hours after online publication and is updated daily on week days.
Initial download of the metrics may take a while.