Fig. 14
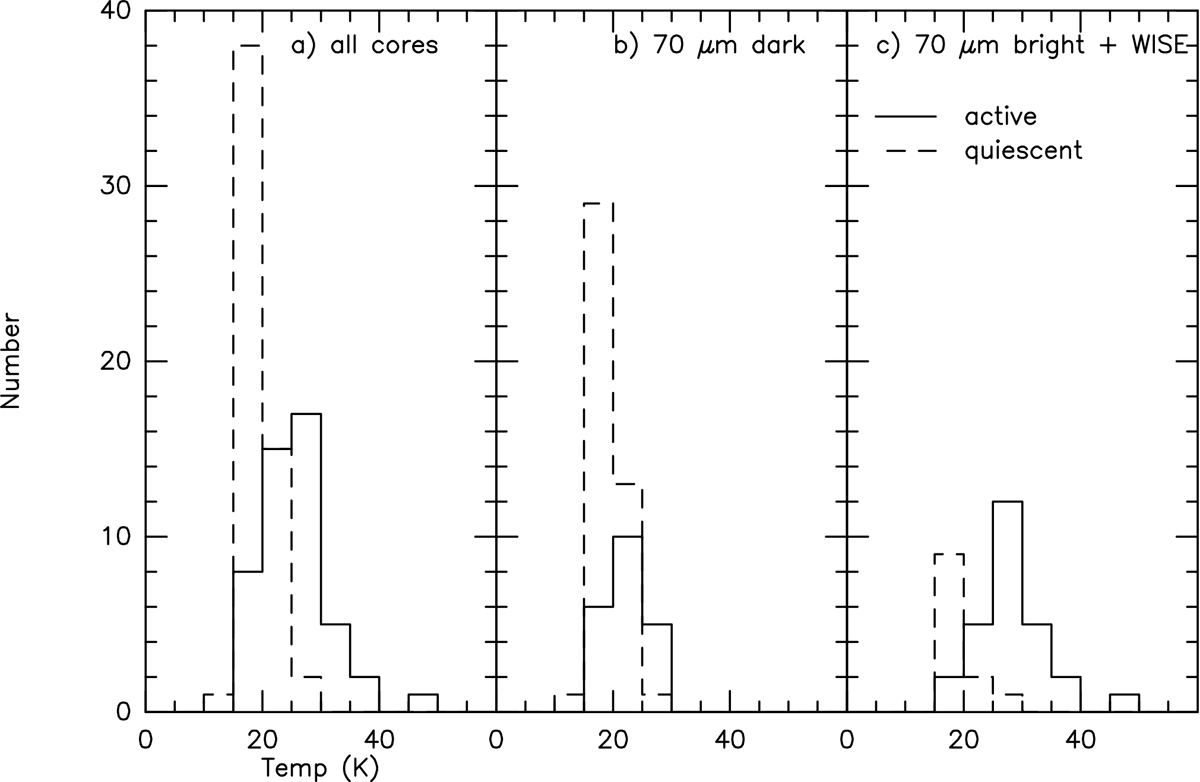
Distribution of temperatures for cores in the active (full line) and quiescent (dashed line) regions. Only cores with M > 5 M⊙ (i.e. above the mass completeness limit) have been included. (a) All cores. (b) Cores with no emission at 70 μm and no red WISE sources associated. (c) Cores associated with 70 μm emission and/or red WISE sources.
Current usage metrics show cumulative count of Article Views (full-text article views including HTML views, PDF and ePub downloads, according to the available data) and Abstracts Views on Vision4Press platform.
Data correspond to usage on the plateform after 2015. The current usage metrics is available 48-96 hours after online publication and is updated daily on week days.
Initial download of the metrics may take a while.