Fig. 12
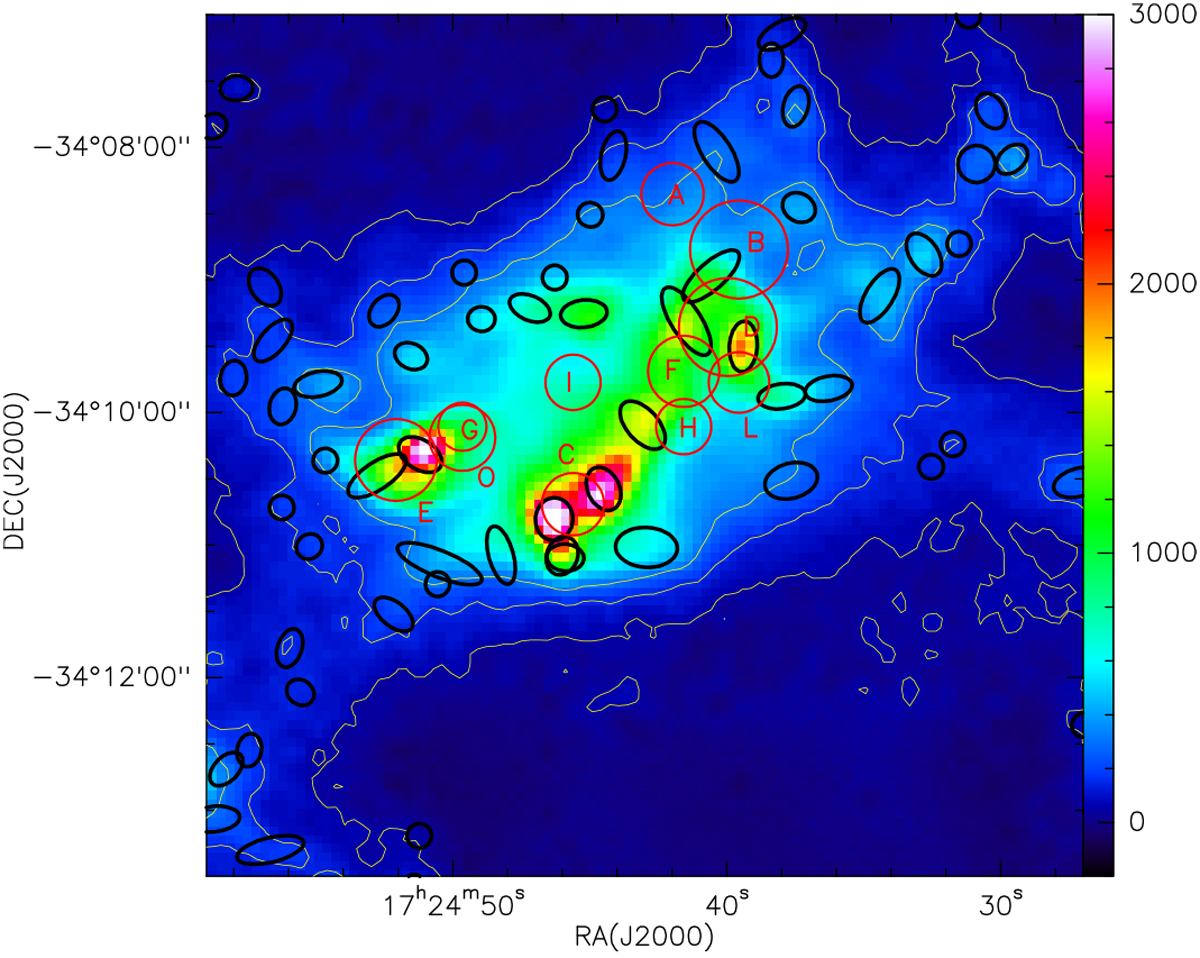
Continuum emission at 850 μm towards G353.2+0.9, overlaid with the locations of the gas cores found by Giannetti et al. (2012; red circles of size equal to that of a clump) and of the dense cores retrieved in this work (black ellipses). The gas clumps are labelled according to Giannetti et al. (2012). Units are mJy beam−1. Contour levels are 50, 150, and 300 mJy beam−1.
Current usage metrics show cumulative count of Article Views (full-text article views including HTML views, PDF and ePub downloads, according to the available data) and Abstracts Views on Vision4Press platform.
Data correspond to usage on the plateform after 2015. The current usage metrics is available 48-96 hours after online publication and is updated daily on week days.
Initial download of the metrics may take a while.