Fig. 10
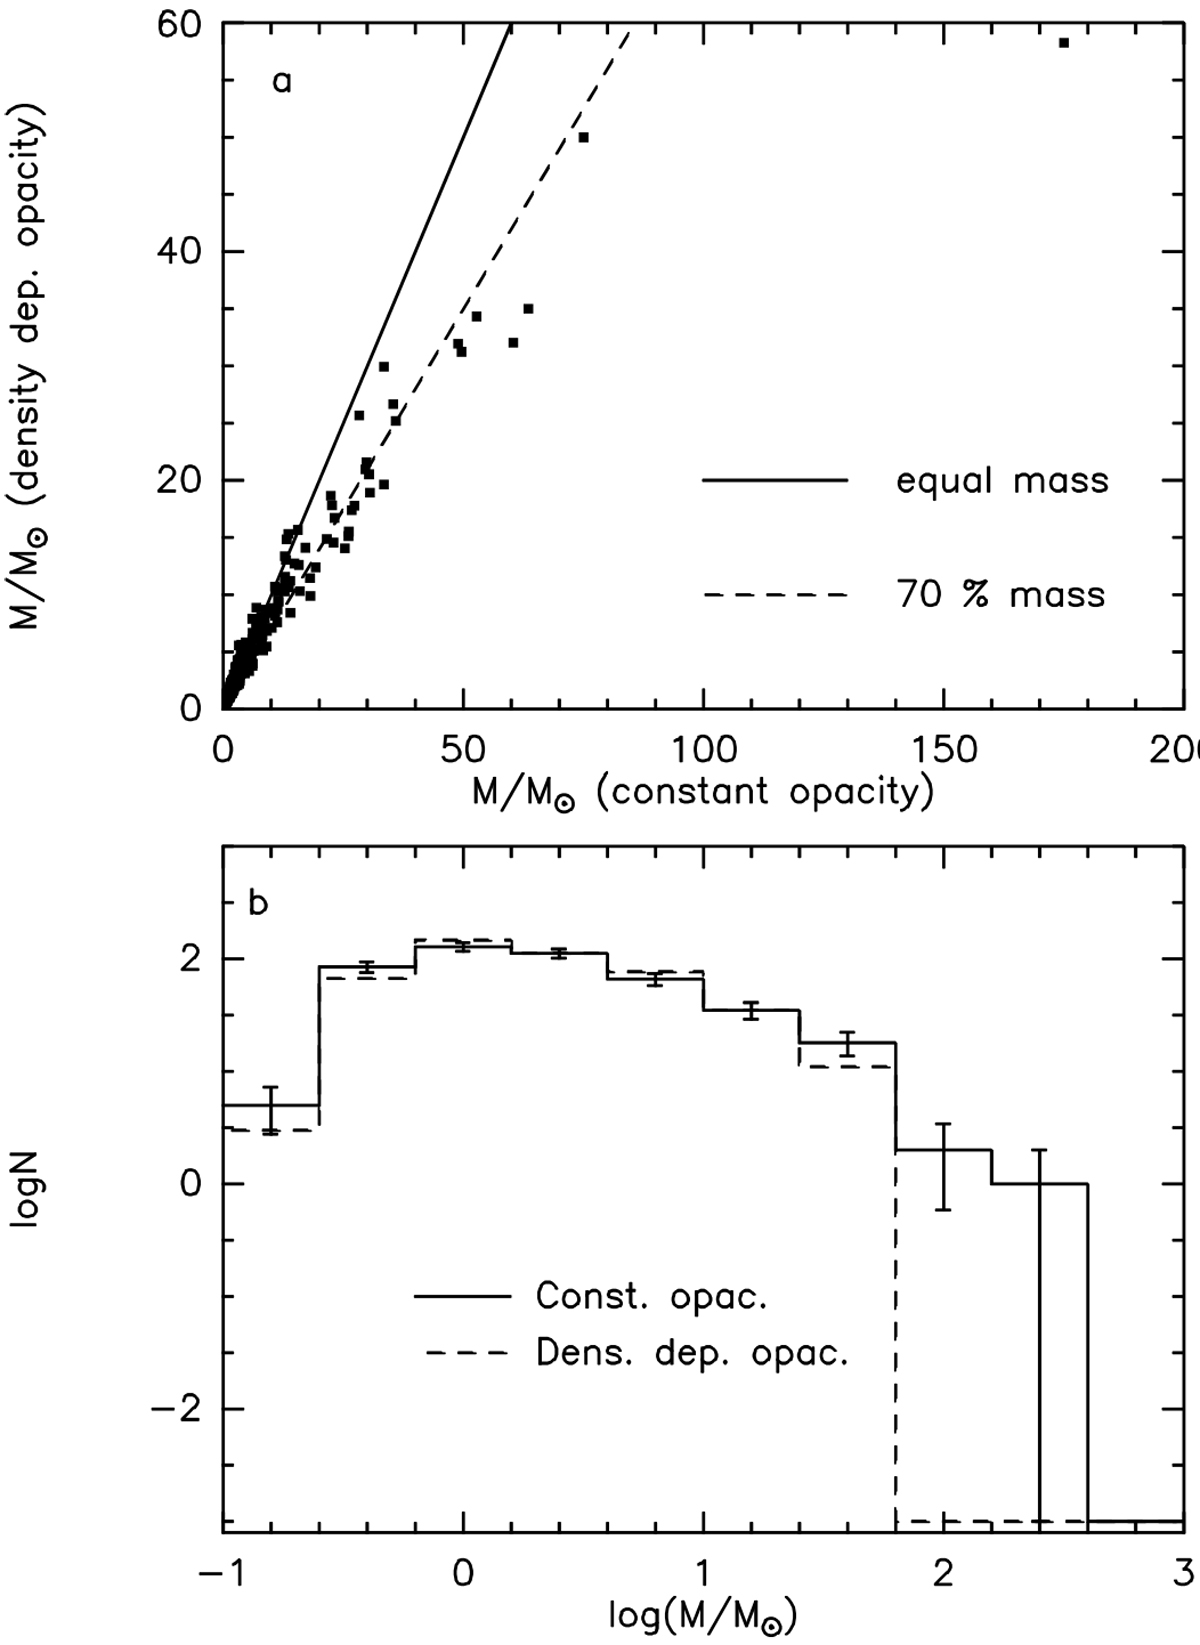
Core masses and core mass distribution. (a) Core masses derived using a density-dependent opacity (grains with no ice mantles) vs. masses derived using a constant dust opacity of 1.93 cm 2 g−1 (at 850 μm). The full line marks equal masses, whereas the dashed line marks density-dependent opacity masses equal to 70% of the constant density masses. (b) Core mass distributions for masses obtained with a constant dust opacity of 1.93 cm 2 g−1 (at 850 μm; full line) and for masses obtained with a density-dependent opacity (dashed line). The error bars have been computed assuming a Poisson statistics.
Current usage metrics show cumulative count of Article Views (full-text article views including HTML views, PDF and ePub downloads, according to the available data) and Abstracts Views on Vision4Press platform.
Data correspond to usage on the plateform after 2015. The current usage metrics is available 48-96 hours after online publication and is updated daily on week days.
Initial download of the metrics may take a while.