Free Access
Fig. 1
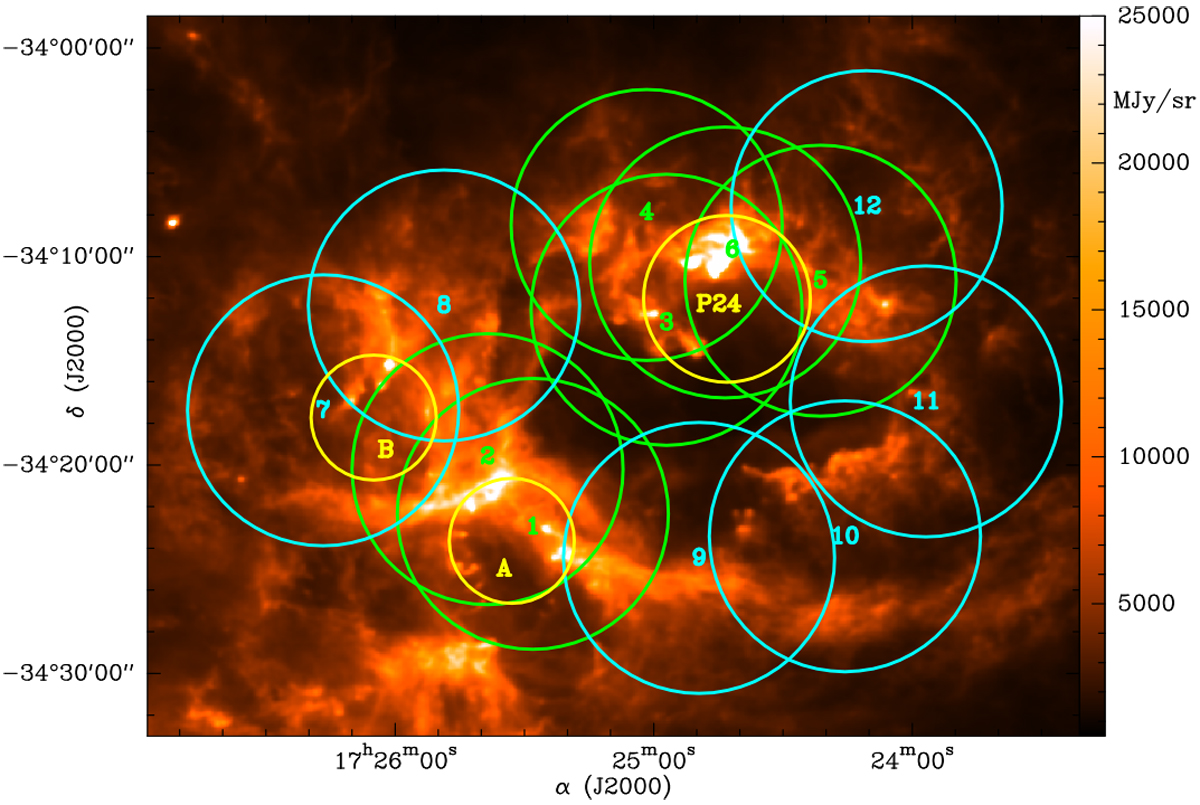
Herschel HiGAL 160 μm map (colour scale) with fields observed in 2012 (1–6; green) and 2015 (7–12; blue). The location and approximate size of star clusters are marked in yellow (Massi et al. 2015). The linear size of the region shown is approximately 22 × 17 pc2.
Current usage metrics show cumulative count of Article Views (full-text article views including HTML views, PDF and ePub downloads, according to the available data) and Abstracts Views on Vision4Press platform.
Data correspond to usage on the plateform after 2015. The current usage metrics is available 48-96 hours after online publication and is updated daily on week days.
Initial download of the metrics may take a while.