Fig. 4.
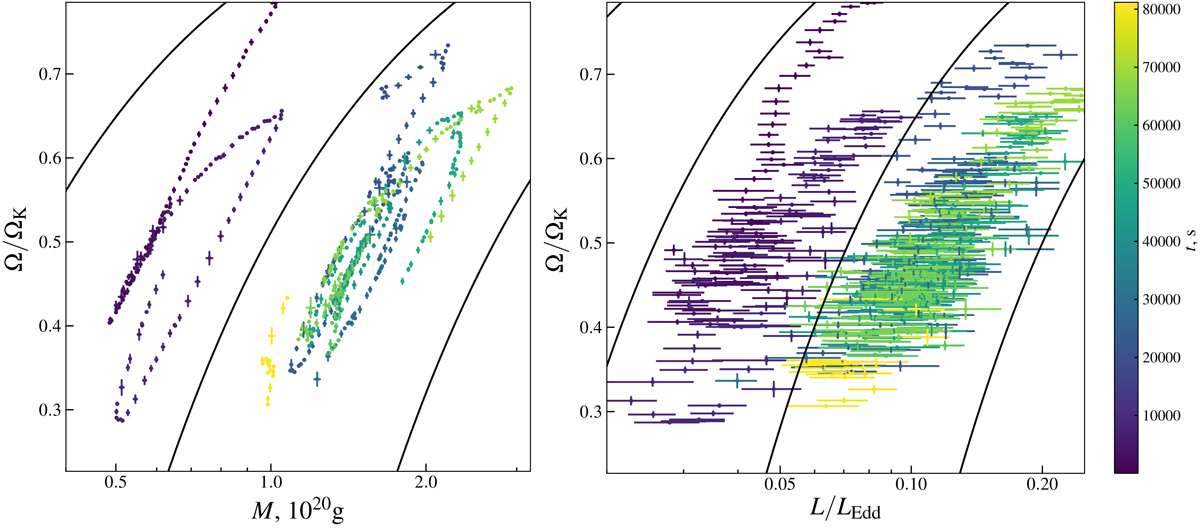
Parallel tracks on the M − Ω and L − Ω planes for a simulation with α = 10−7, q = 0.56, D = 0.5, and p = 1.3. Solid black lines are the lines of (ΩK−Ω)M = const and (ΩK−Ω)L=const. Time is color-coded (see the colorbar on the right). To demonstrate the parallel tracks effect during multiple observation runs, we show only the data points in 104 s intervals separated by 104 s gaps.
Current usage metrics show cumulative count of Article Views (full-text article views including HTML views, PDF and ePub downloads, according to the available data) and Abstracts Views on Vision4Press platform.
Data correspond to usage on the plateform after 2015. The current usage metrics is available 48-96 hours after online publication and is updated daily on week days.
Initial download of the metrics may take a while.