Fig. 3.
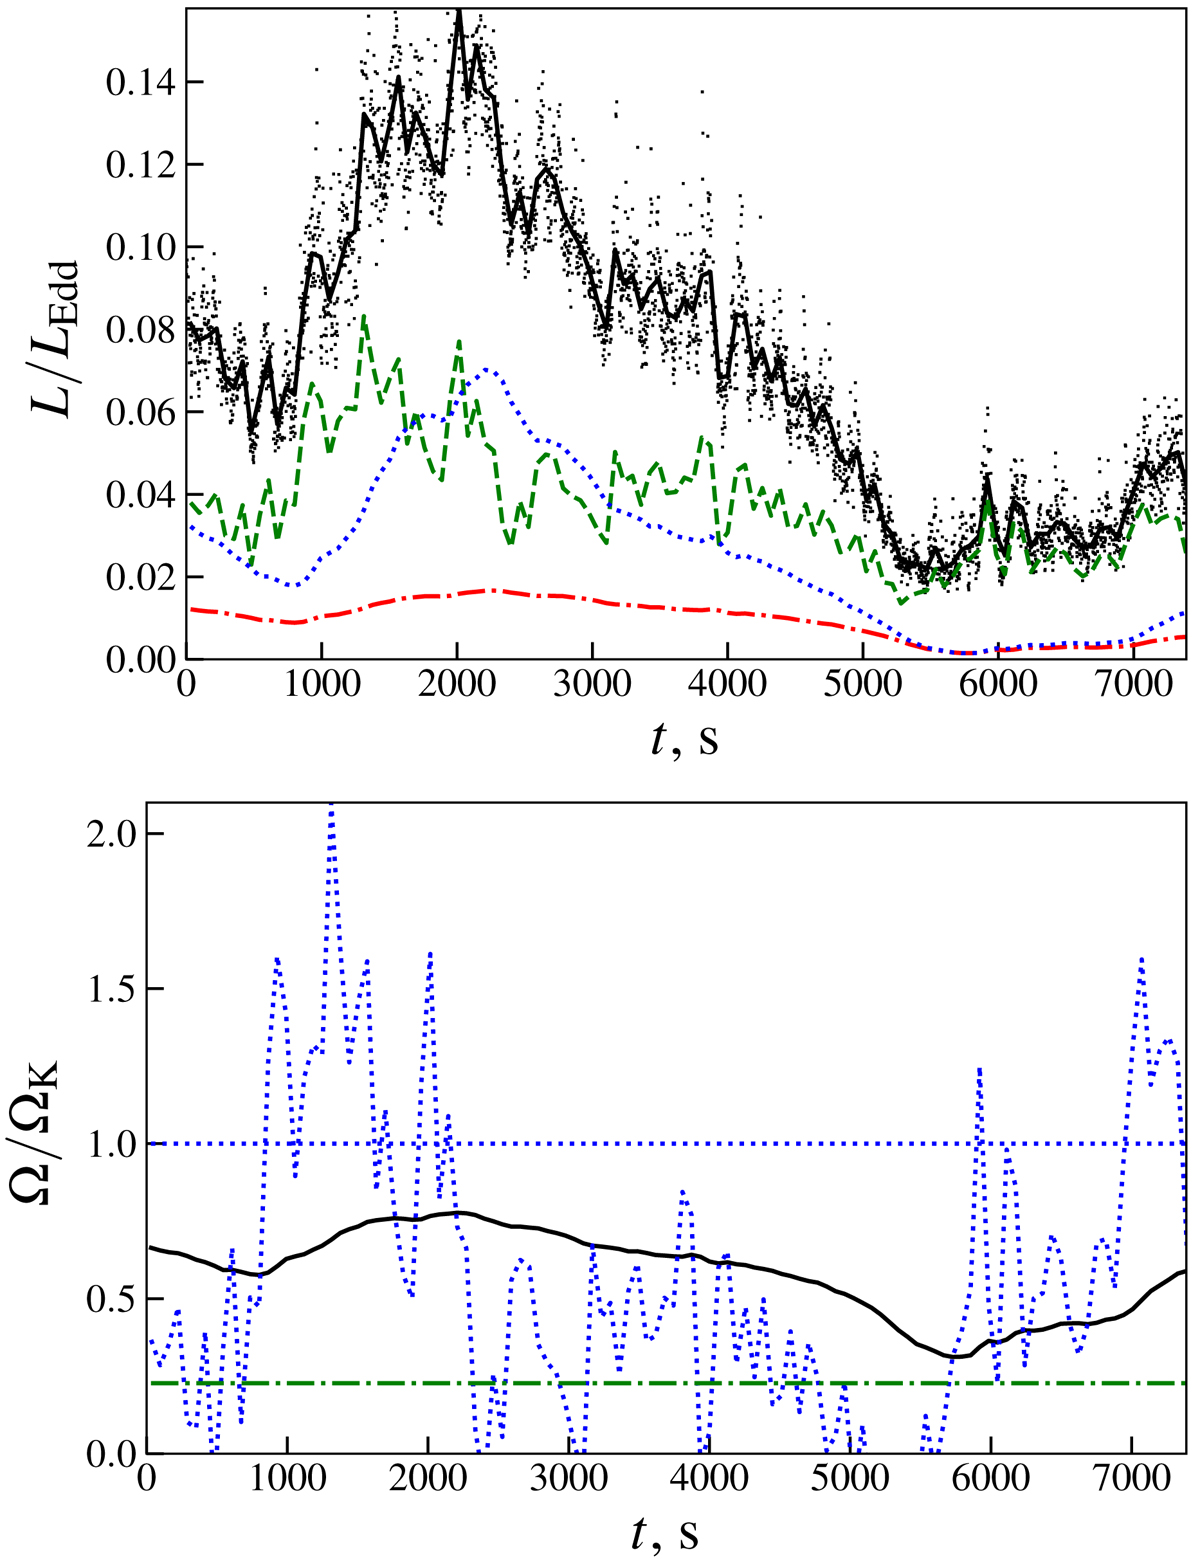
Luminosity and frequency variations with time. Upper panel: portion of the light curve of the simulation with α = 10−7 and q = 0.6. The solid black curve shows the total 64-second-averaged luminosity (Eq. 6). We also show three contributions to the luminosity separately: The first, second, and third terms from Eq. (6) are plotted with dashed green, dotted blue, and dot-dashed red lines, respectively. The black dots are instantaneous luminosity values (every 2 s). Lower panel: rotation frequency Ω (solid black line) and Ω± (dotted blue lines) for the same model. The horizontal dashed green line corresponds to the spin of the NS.
Current usage metrics show cumulative count of Article Views (full-text article views including HTML views, PDF and ePub downloads, according to the available data) and Abstracts Views on Vision4Press platform.
Data correspond to usage on the plateform after 2015. The current usage metrics is available 48-96 hours after online publication and is updated daily on week days.
Initial download of the metrics may take a while.