Fig. 2.
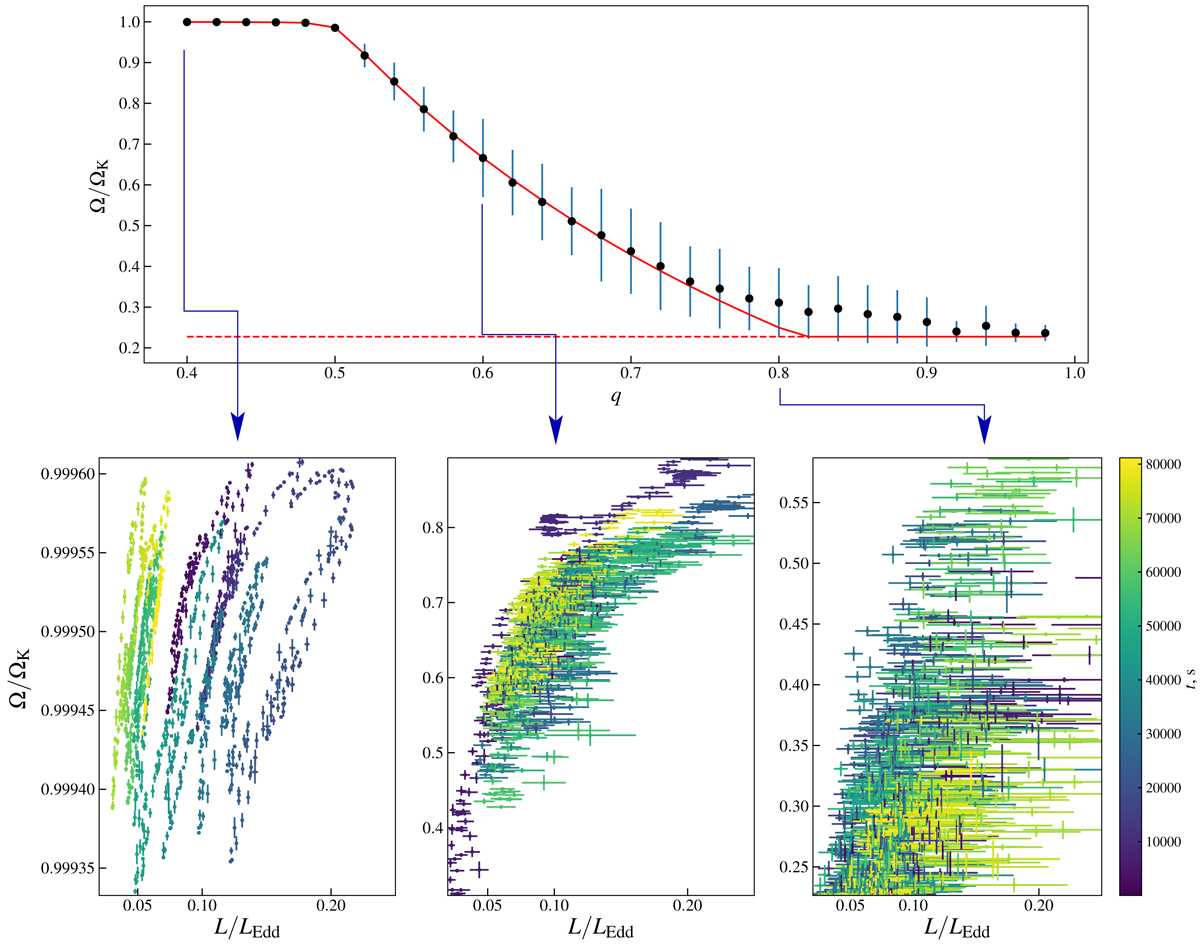
Rotation frequency dependence on q and luminosity. Upper panel: mean BL rotation frequency (black dots; error bars show the root-mean-square variations of Ω) as a function of q compared to the equilibrium value, Ω− (solid red line). The dashed red line shows the rotation frequency of the NS (3 ms). Lower panels: BL rotation frequency dependence on instantaneous luminosity for sample light curves with three different values of depletion time corresponding to q = 0.4, 0.6, and 0.8. In all the simulations, α = 10−7. Time in the lower panels is color-coded (see the colorbar on the right). The crosses are the average values calculated for 64 s time bins, and the error bars show the standard deviation.
Current usage metrics show cumulative count of Article Views (full-text article views including HTML views, PDF and ePub downloads, according to the available data) and Abstracts Views on Vision4Press platform.
Data correspond to usage on the plateform after 2015. The current usage metrics is available 48-96 hours after online publication and is updated daily on week days.
Initial download of the metrics may take a while.