Fig. 1.
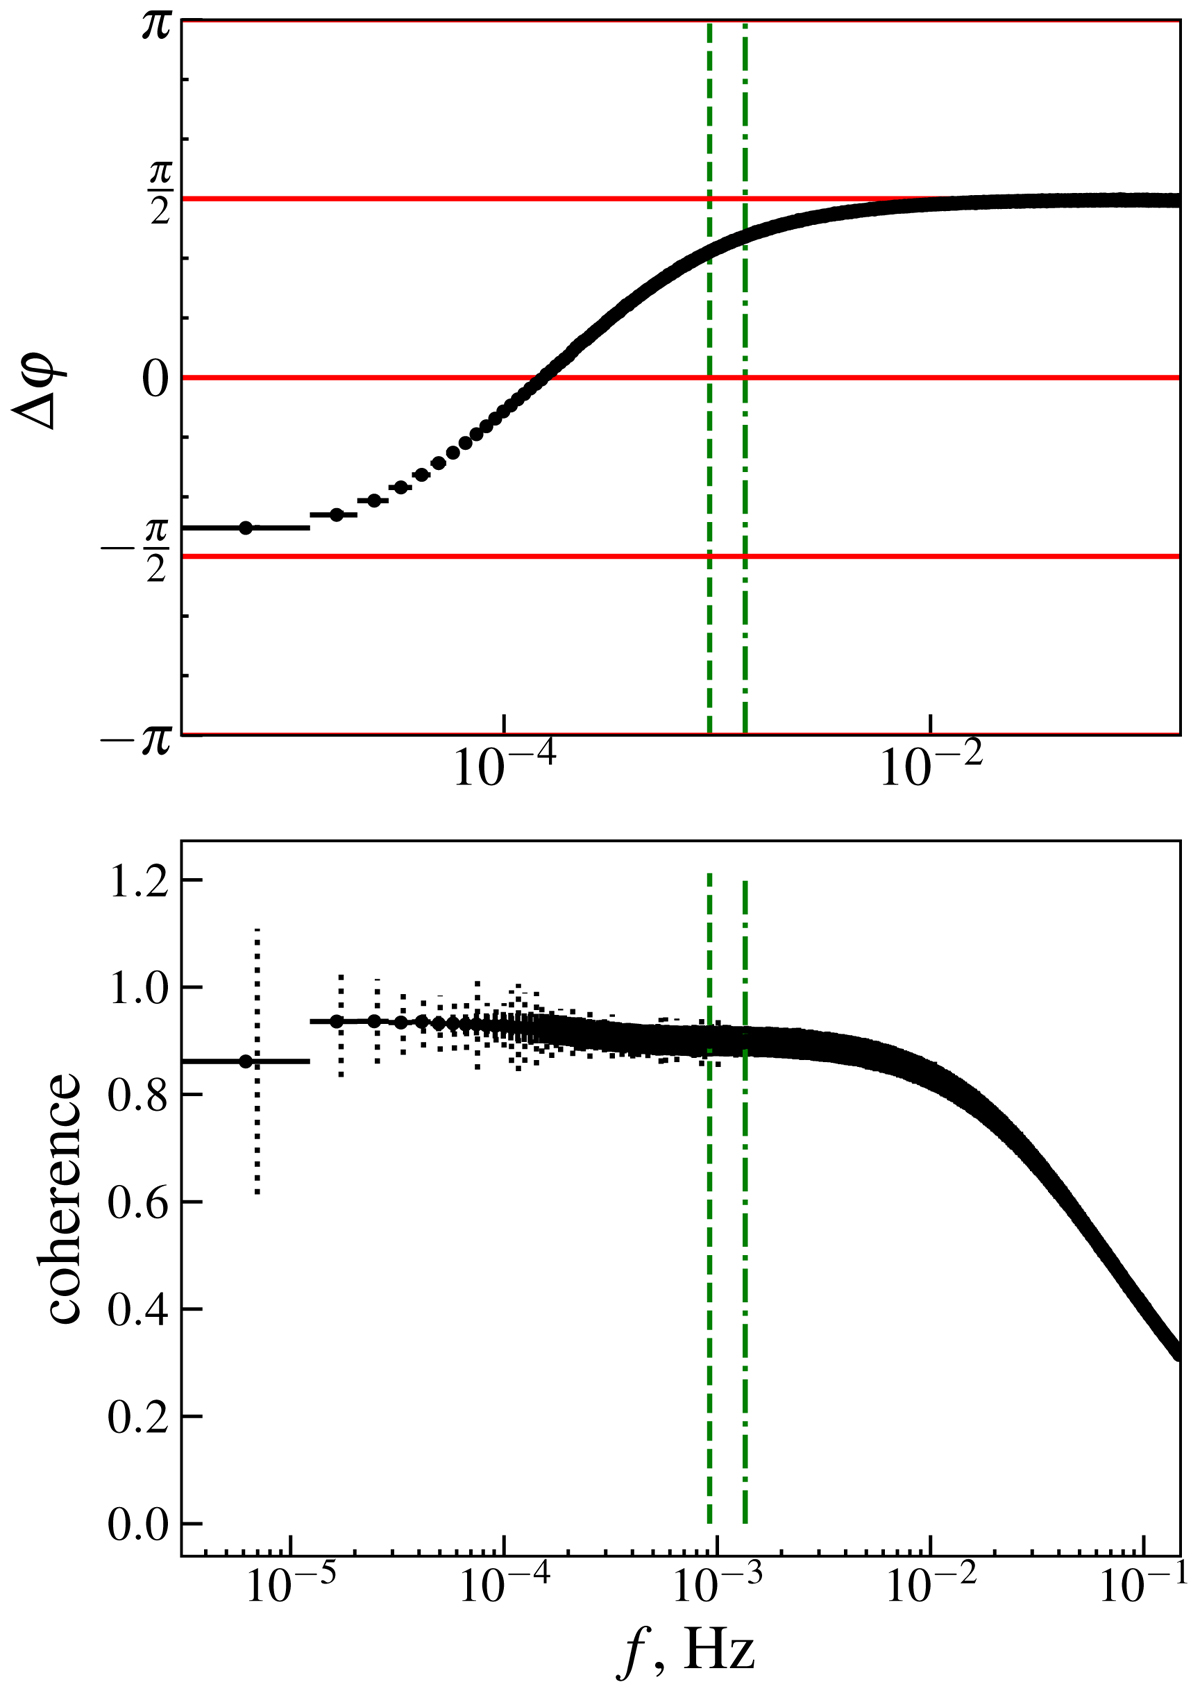
Phase lags (upper panel) and coherence (lower panel) between the instantaneous luminosity of the BL, L, and its rotation frequency, Ω. A positive phase lag means that Ω lags L. The vertical green lines show the frequencies corresponding to the depletion tdepl (dot-dashed) and the friction 1/αΩK (dashed) time scales. Additional error bars (vertical dotted black lines) show the variability of the quantities within the bin. The parameters are α = 10−7, tdepl ≃ 740 s (corresponding to q ≃ 0.68), and a NS spin period of 3 ms.
Current usage metrics show cumulative count of Article Views (full-text article views including HTML views, PDF and ePub downloads, according to the available data) and Abstracts Views on Vision4Press platform.
Data correspond to usage on the plateform after 2015. The current usage metrics is available 48-96 hours after online publication and is updated daily on week days.
Initial download of the metrics may take a while.