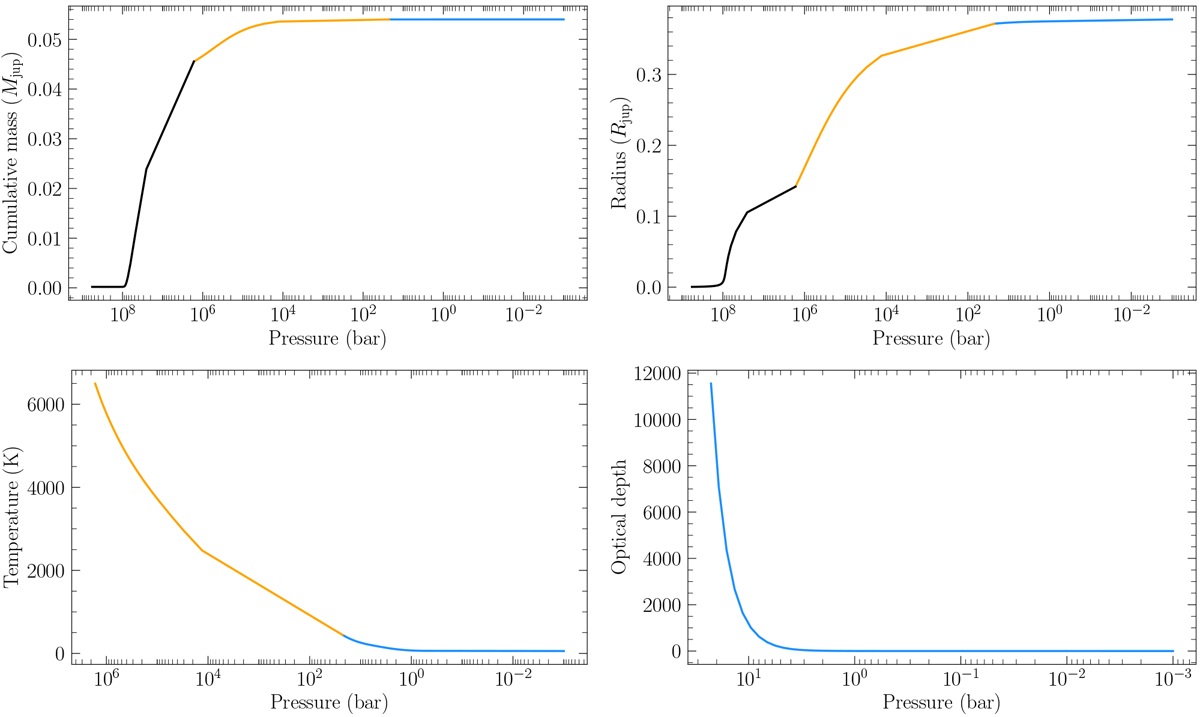
Fig. 6
Download original image
Profiles for the test simulation of Neptune as a function of logP. The blue curves correspond to Zone A, the orange curves correspond to Zone B, and the black curves to the rocky core. The parameters of the simulation are: a = 30 AU, Mcore = 0.85Mpl, Mpl = 1Mnept, Lbol =1 L⊙, and YHe = 0.2. Top left: cumulative mass of the planet. Top right: radius of the planet. Bottom left: temperature. Bottom right: optical depth in thermal wavelengths.
Current usage metrics show cumulative count of Article Views (full-text article views including HTML views, PDF and ePub downloads, according to the available data) and Abstracts Views on Vision4Press platform.
Data correspond to usage on the plateform after 2015. The current usage metrics is available 48-96 hours after online publication and is updated daily on week days.
Initial download of the metrics may take a while.