Free Access
Fig. 10
Download original image
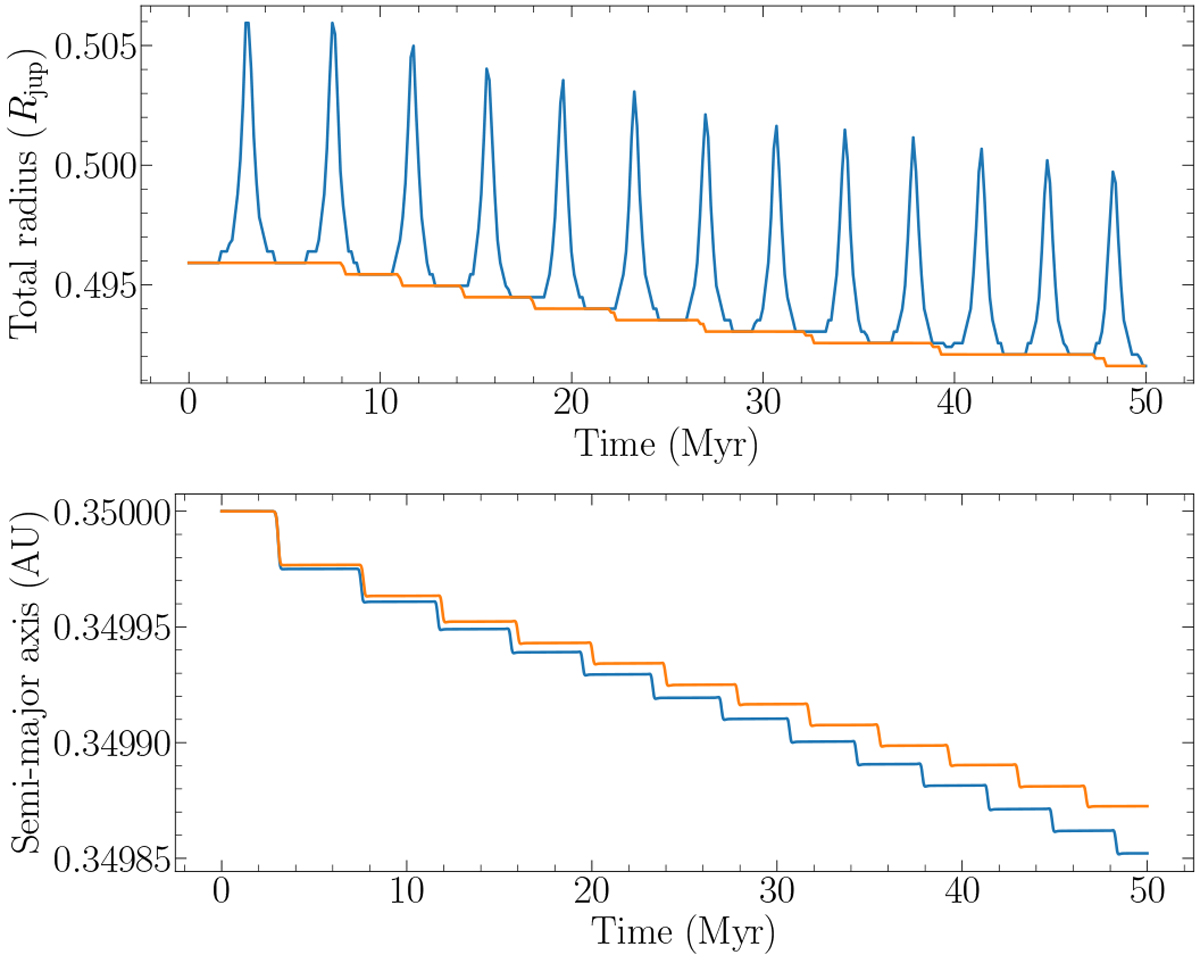
Top: evolution of the planetary radius during the first 50 Myr. Bottom: evolution of the semi-major axis during the first 50 Myr. The blue lines represent the simulation where Lbol is averaged over the inner orbit, as opposed to the orange lines where it is not.
Current usage metrics show cumulative count of Article Views (full-text article views including HTML views, PDF and ePub downloads, according to the available data) and Abstracts Views on Vision4Press platform.
Data correspond to usage on the plateform after 2015. The current usage metrics is available 48-96 hours after online publication and is updated daily on week days.
Initial download of the metrics may take a while.