Fig. 9
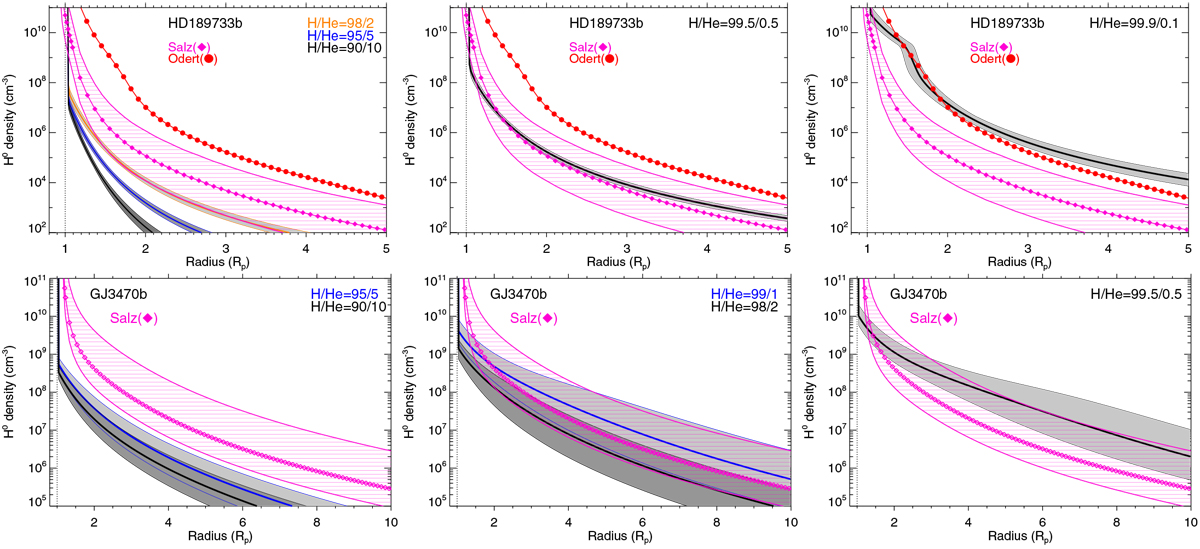
Range of the neutral hydrogen concentration profiles (in grey shade areas) resulting from the fit of the measured absorption (filled circles in Fig. 4) for HD 189733 b (upper panels), GJ 3470 b (lower panels), and several H/He ratios, as labelled. The solid thicker curves are the mean profiles. The H0 density derived from Lyα measurements for HD 189733 b and GJ 3470 b by Salz et al. (2016) and our estimated uncertainties (× 10 and /10 for HD 189733 b, as well as ×10 and /![]() for GJ 3470 b) are also shown (diamonds and hatched areas in magenta). The red profile is the H0 density derived by Odert et al. (2020) from their SF11 model for HD 189733 b.
for GJ 3470 b) are also shown (diamonds and hatched areas in magenta). The red profile is the H0 density derived by Odert et al. (2020) from their SF11 model for HD 189733 b.
Current usage metrics show cumulative count of Article Views (full-text article views including HTML views, PDF and ePub downloads, according to the available data) and Abstracts Views on Vision4Press platform.
Data correspond to usage on the plateform after 2015. The current usage metrics is available 48-96 hours after online publication and is updated daily on week days.
Initial download of the metrics may take a while.