Free Access
Fig. 8
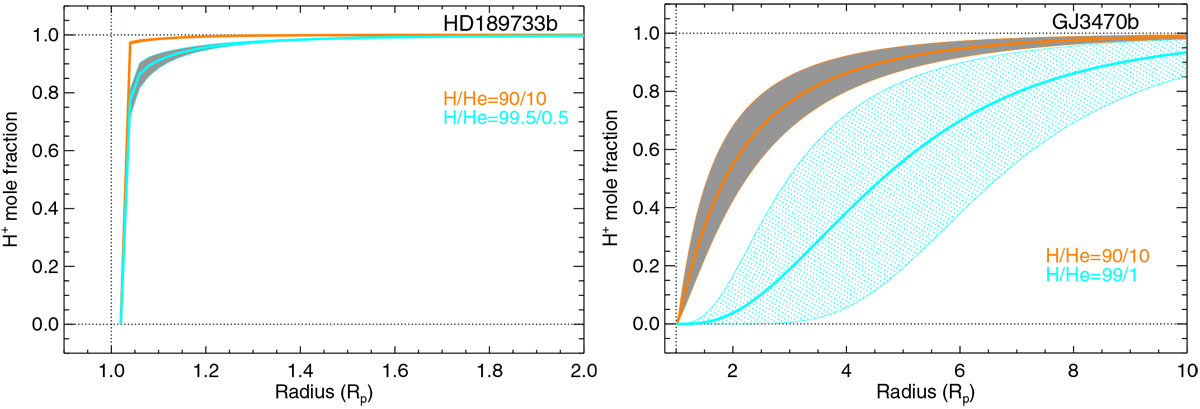
H+ mole fraction profiles resulting from the fit of the measured absorption (filled circles in Fig. 4) for H/He = 90/10 and 99.5/0.5 for HD 189733 b (left panel) and 90/10 and 99/1 for GJ 3470 b (right panel). We note the different x-axis range. The solid thicker lines are the mean profiles.
Current usage metrics show cumulative count of Article Views (full-text article views including HTML views, PDF and ePub downloads, according to the available data) and Abstracts Views on Vision4Press platform.
Data correspond to usage on the plateform after 2015. The current usage metrics is available 48-96 hours after online publication and is updated daily on week days.
Initial download of the metrics may take a while.