Fig. 4
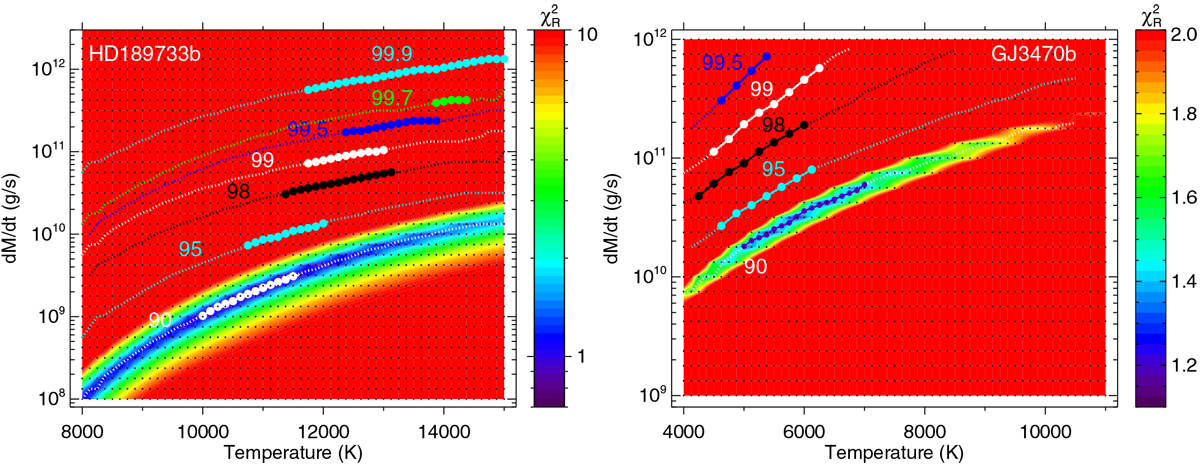
Contour maps of the reduced χ2 of the He(23S) absorption for HD 189733 b (left panel) and GJ 3470 b (right panel) for an H/He ratio of 90/10. We note the different scales of temperatures and Ṁ. Dotted curves represent the best fits with filled circles denoting the constrained ranges for a confidence level of 95% (see Sect. 3.4). Over-plotted are also the curves and symbols for several H/He ratios, as labelled. The labels correspond to the hydrogen percentage, e.g. ‘90’ for an H/He of 90/10 and ‘95’ for H/He = 95/5 (see Sect. 4.4). The black dots represent the grid of the simulations.
Current usage metrics show cumulative count of Article Views (full-text article views including HTML views, PDF and ePub downloads, according to the available data) and Abstracts Views on Vision4Press platform.
Data correspond to usage on the plateform after 2015. The current usage metrics is available 48-96 hours after online publication and is updated daily on week days.
Initial download of the metrics may take a while.