Fig. 3
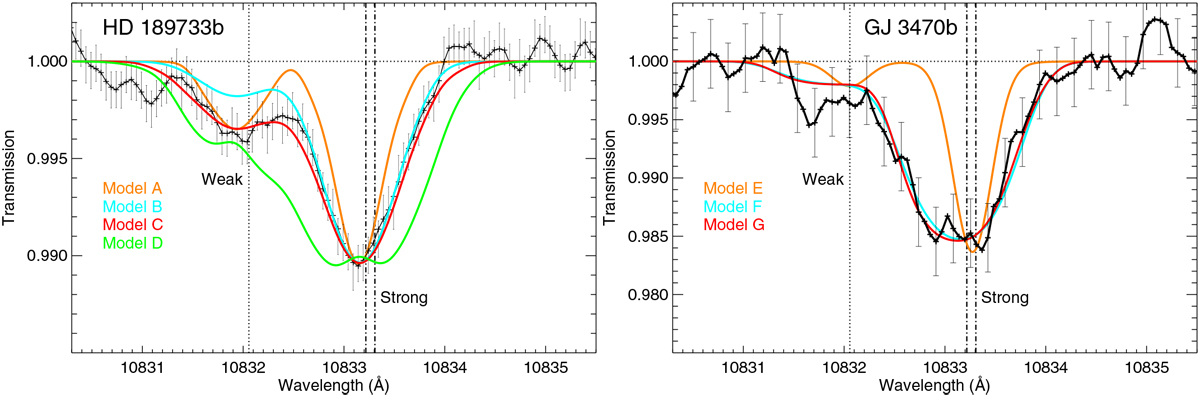
Spectral transmission of the He triplet at mid-transit for HD 189733 b and GJ 3470 b (we note the different y-axis scale). Data points and their respective error bars are shown in black (adapted from Salz et al. 2018 and Pallé et al. 2020, respectively). Wavelengths are given in vacuum. The best-fit simulations are shown with red curves. For HD 189733 b, the best fit corresponds to a temperature of 10 000 K, a mass-loss rate of 109 g s−1 and an H/He mole-fraction of 90/10. For GJ 3470 b, the best fit corresponds to a temperature of 6000 K, Ṁ = 3.2 × 10¹⁰ g s−1 and an H/He of 90/10. Other models are described in Table 2. The positions of the helium lines are marked by vertical dotted (weak) and dot-dashed (strong) lines.
Current usage metrics show cumulative count of Article Views (full-text article views including HTML views, PDF and ePub downloads, according to the available data) and Abstracts Views on Vision4Press platform.
Data correspond to usage on the plateform after 2015. The current usage metrics is available 48-96 hours after online publication and is updated daily on week days.
Initial download of the metrics may take a while.