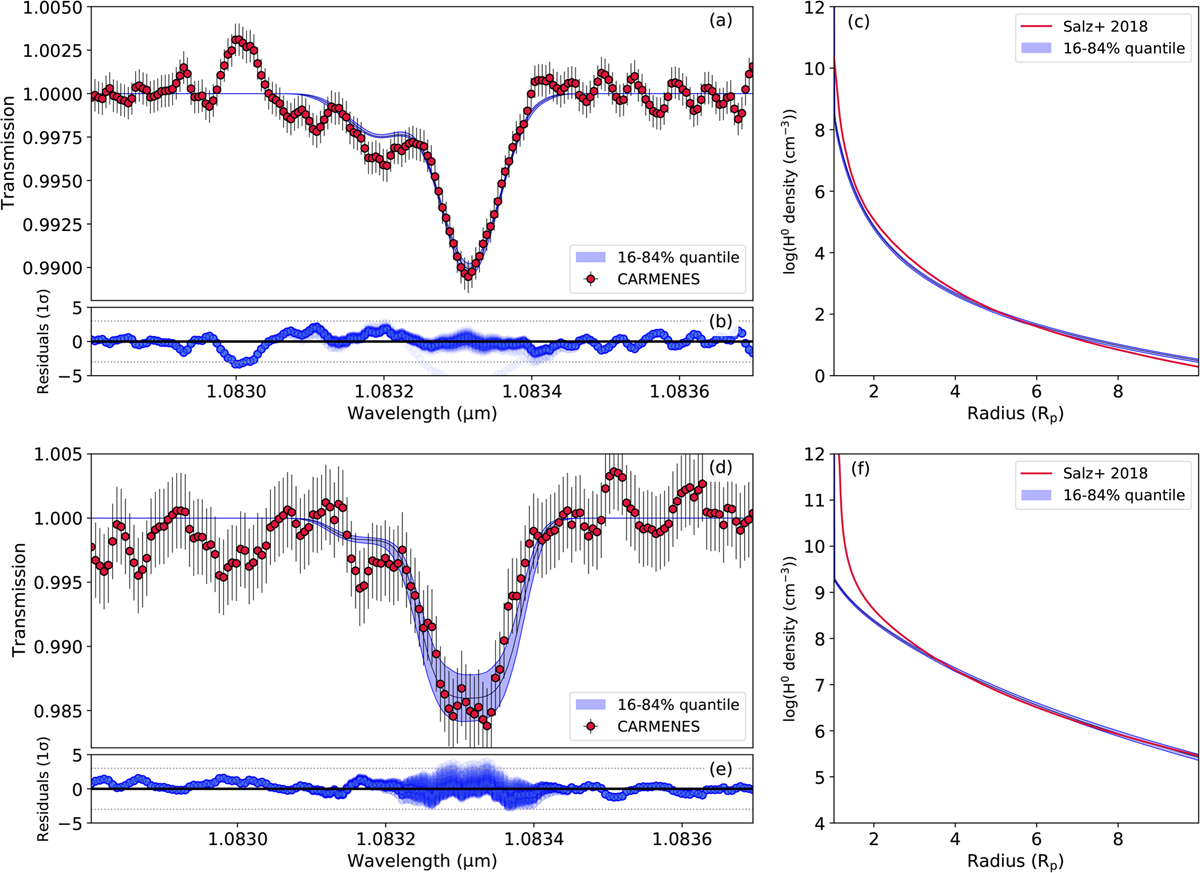
Fig. 10

Bayesian inference of upper thermospheric conditions for HD 189733 b and GJ 3470 b. (a) Comparison of the best-fit model spectra (blue shaded area) and of the measured He triplet line for HD 189733 b (red data points). (b) Residualof the fitted models for HD 189733 b. The dotted horizontal lines mark 3-σ. (c) Comparison of the best-fit model H0 density (shaded blue area) and of the estimated H0 density from Lyα measurements for HD 189733 b (red data points). For the models, the blue area corresponds to the region of the posteriors between the 16 and 84% quantiles. d–f are similar to a–c, but for GJ 3470 b.
Current usage metrics show cumulative count of Article Views (full-text article views including HTML views, PDF and ePub downloads, according to the available data) and Abstracts Views on Vision4Press platform.
Data correspond to usage on the plateform after 2015. The current usage metrics is available 48-96 hours after online publication and is updated daily on week days.
Initial download of the metrics may take a while.


