Fig. 1
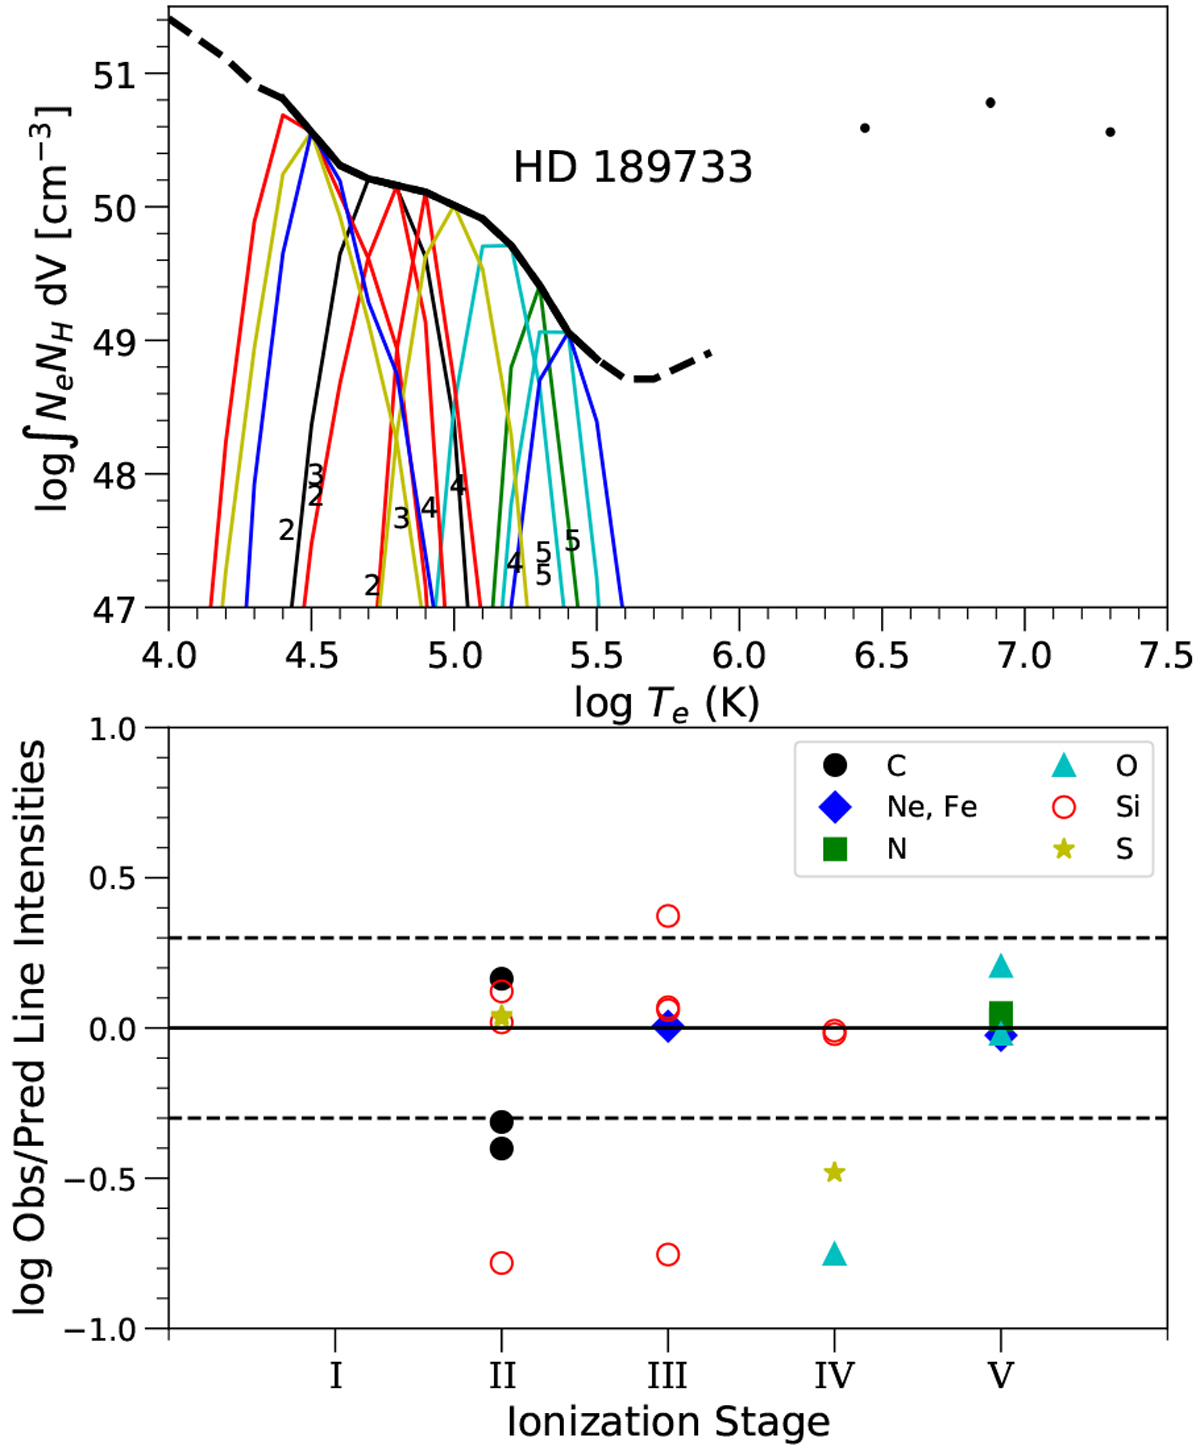
Upper panel: emission measure distribution of HD 189733 calculated using the line fluxes measured in the HSLA/COSsummed spectrum. The 3-T model used to fit XMM-Newton summed EPIC spectra is also displayed. The thin lines represent the relative contribution function for each ion (the emissivity function multiplied by the EMD at each point), following same colour code as in lower panel. The small numbers indicate the ionisation stages of the species. Lower panel: observed-to-predicted line flux ratios for the ion stages in the upper panel. The dotted lines denote a factor of 2.
Current usage metrics show cumulative count of Article Views (full-text article views including HTML views, PDF and ePub downloads, according to the available data) and Abstracts Views on Vision4Press platform.
Data correspond to usage on the plateform after 2015. The current usage metrics is available 48-96 hours after online publication and is updated daily on week days.
Initial download of the metrics may take a while.