Fig. 7.
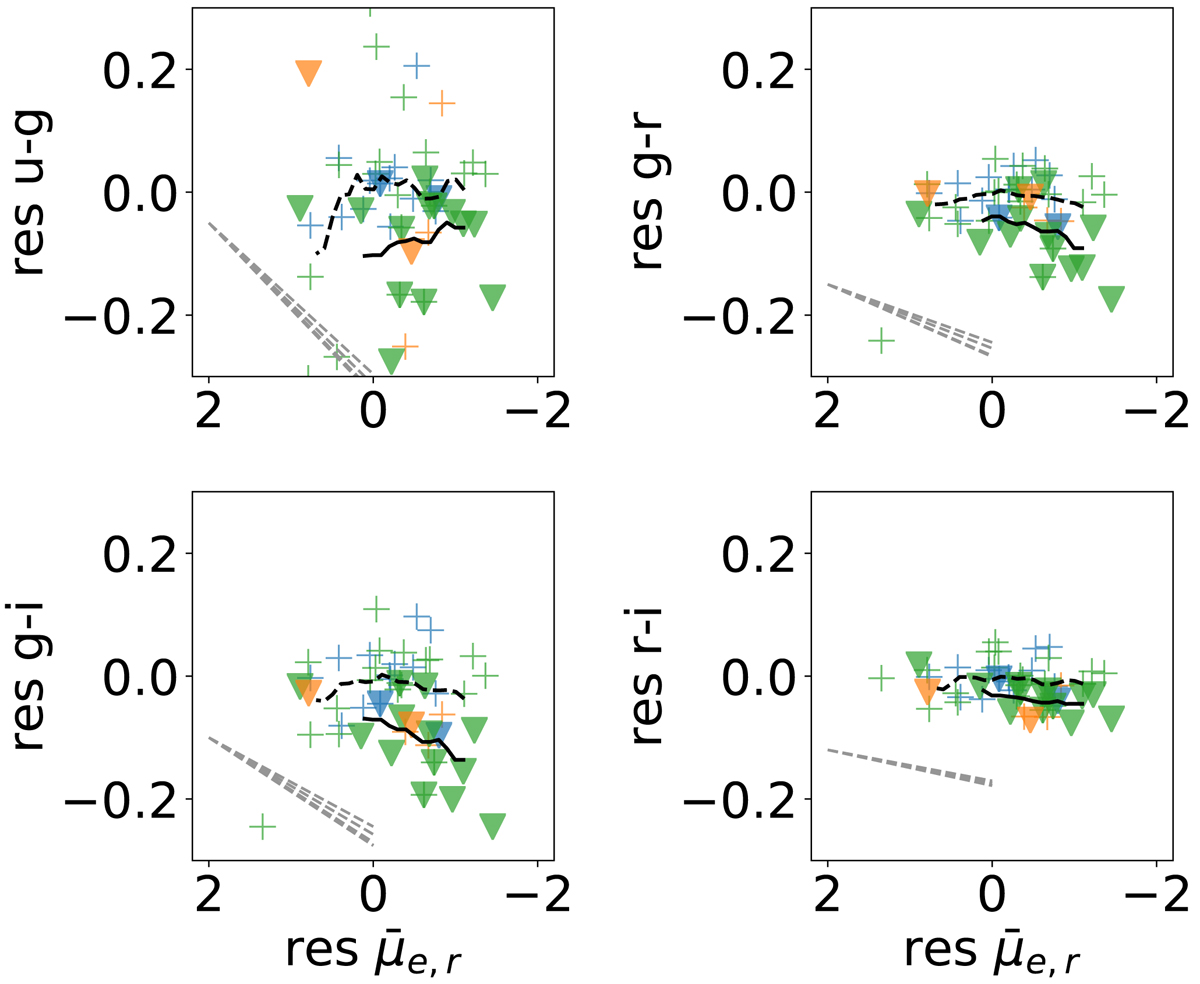
Residual colour versus residual surface brightness for ETGs in the Virgo cluster with disk features (plusses) and blue cores (triangles), i.e. the plots in the left panels of Fig. 5 for this sub-sample of galaxies. The dashed and solid black curves show the running means for the galaxies with disk features and blue cores, respectively. The FRTS (grey lines) is reproduced in the lower left corners, and the colours are the same as in Fig. 1. The dwarf ETGs with blue colours appear to be consistent with the FRTS, and those with disk features less so.
Current usage metrics show cumulative count of Article Views (full-text article views including HTML views, PDF and ePub downloads, according to the available data) and Abstracts Views on Vision4Press platform.
Data correspond to usage on the plateform after 2015. The current usage metrics is available 48-96 hours after online publication and is updated daily on week days.
Initial download of the metrics may take a while.