Fig. 5.
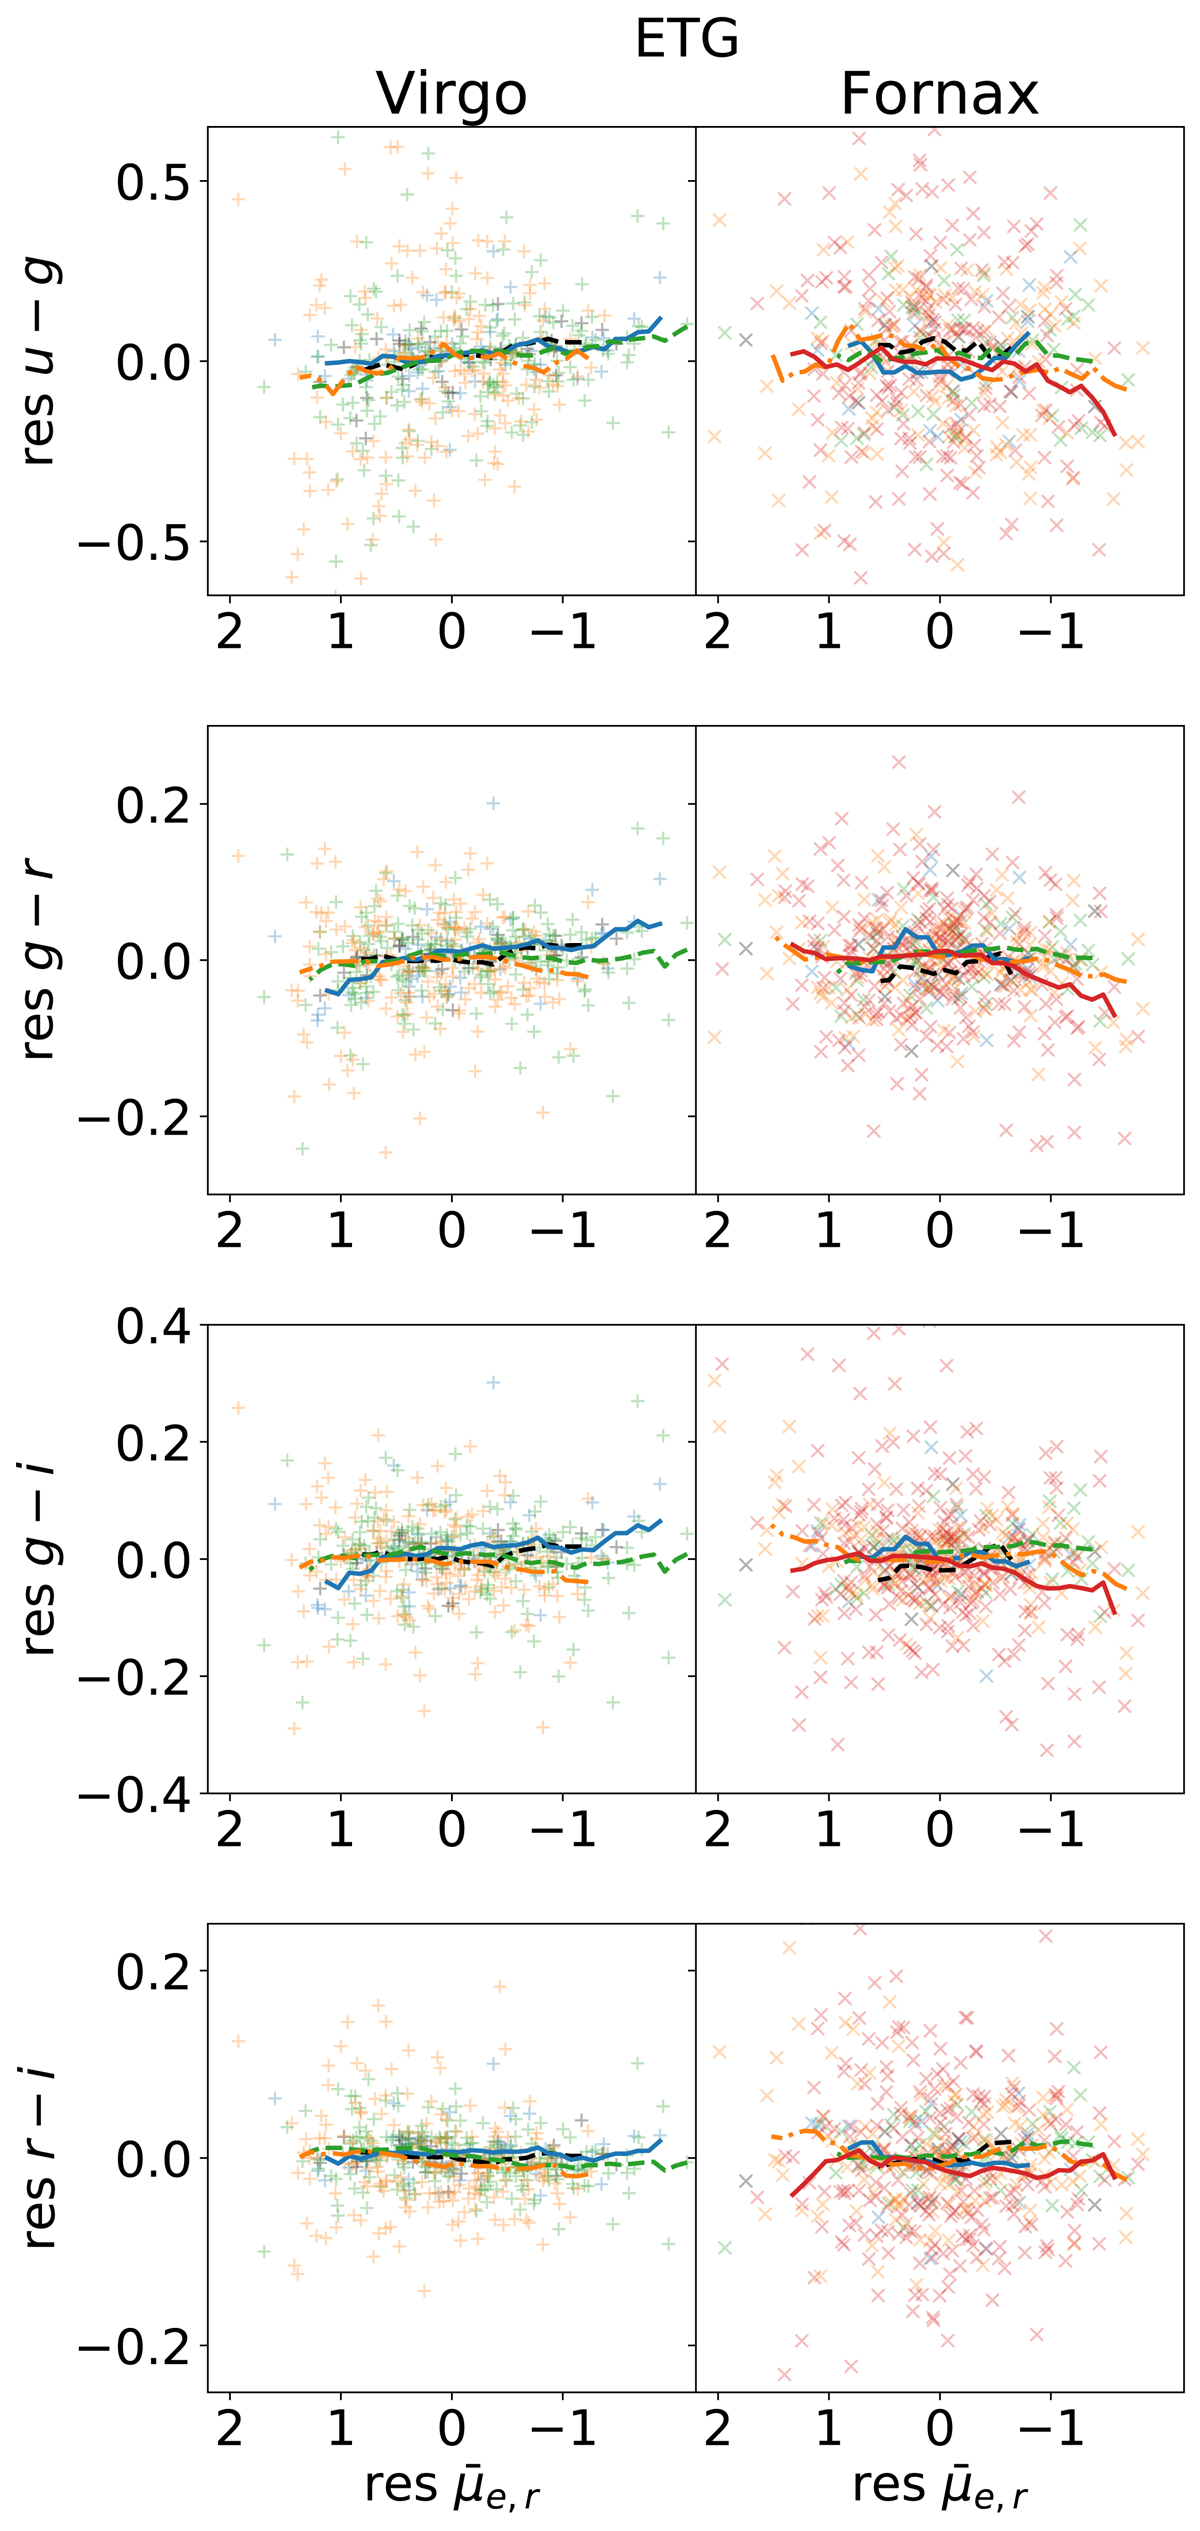
Residual colour versus residual surface brightness for ETGs in the Virgo (left) and Fornax (right) clusters. The residual quantities are obtained by subtracting the mean trends between galaxy mass and the colours and surface brightnesses (see text). The y-range is adjusted to half of that in Fig. 3, with a few points for the lowest-mass bin falling out of the plotting range. The flatness of the relation for all bins (with the possible exception of the u − r colour) indicates that the behaviour of the ETGs in Fig. 4 is determined by the scaling relations of colour and surface brightness with stellar mass. Symbols and colours are the same as in Fig. 1.
Current usage metrics show cumulative count of Article Views (full-text article views including HTML views, PDF and ePub downloads, according to the available data) and Abstracts Views on Vision4Press platform.
Data correspond to usage on the plateform after 2015. The current usage metrics is available 48-96 hours after online publication and is updated daily on week days.
Initial download of the metrics may take a while.