Fig. 4.
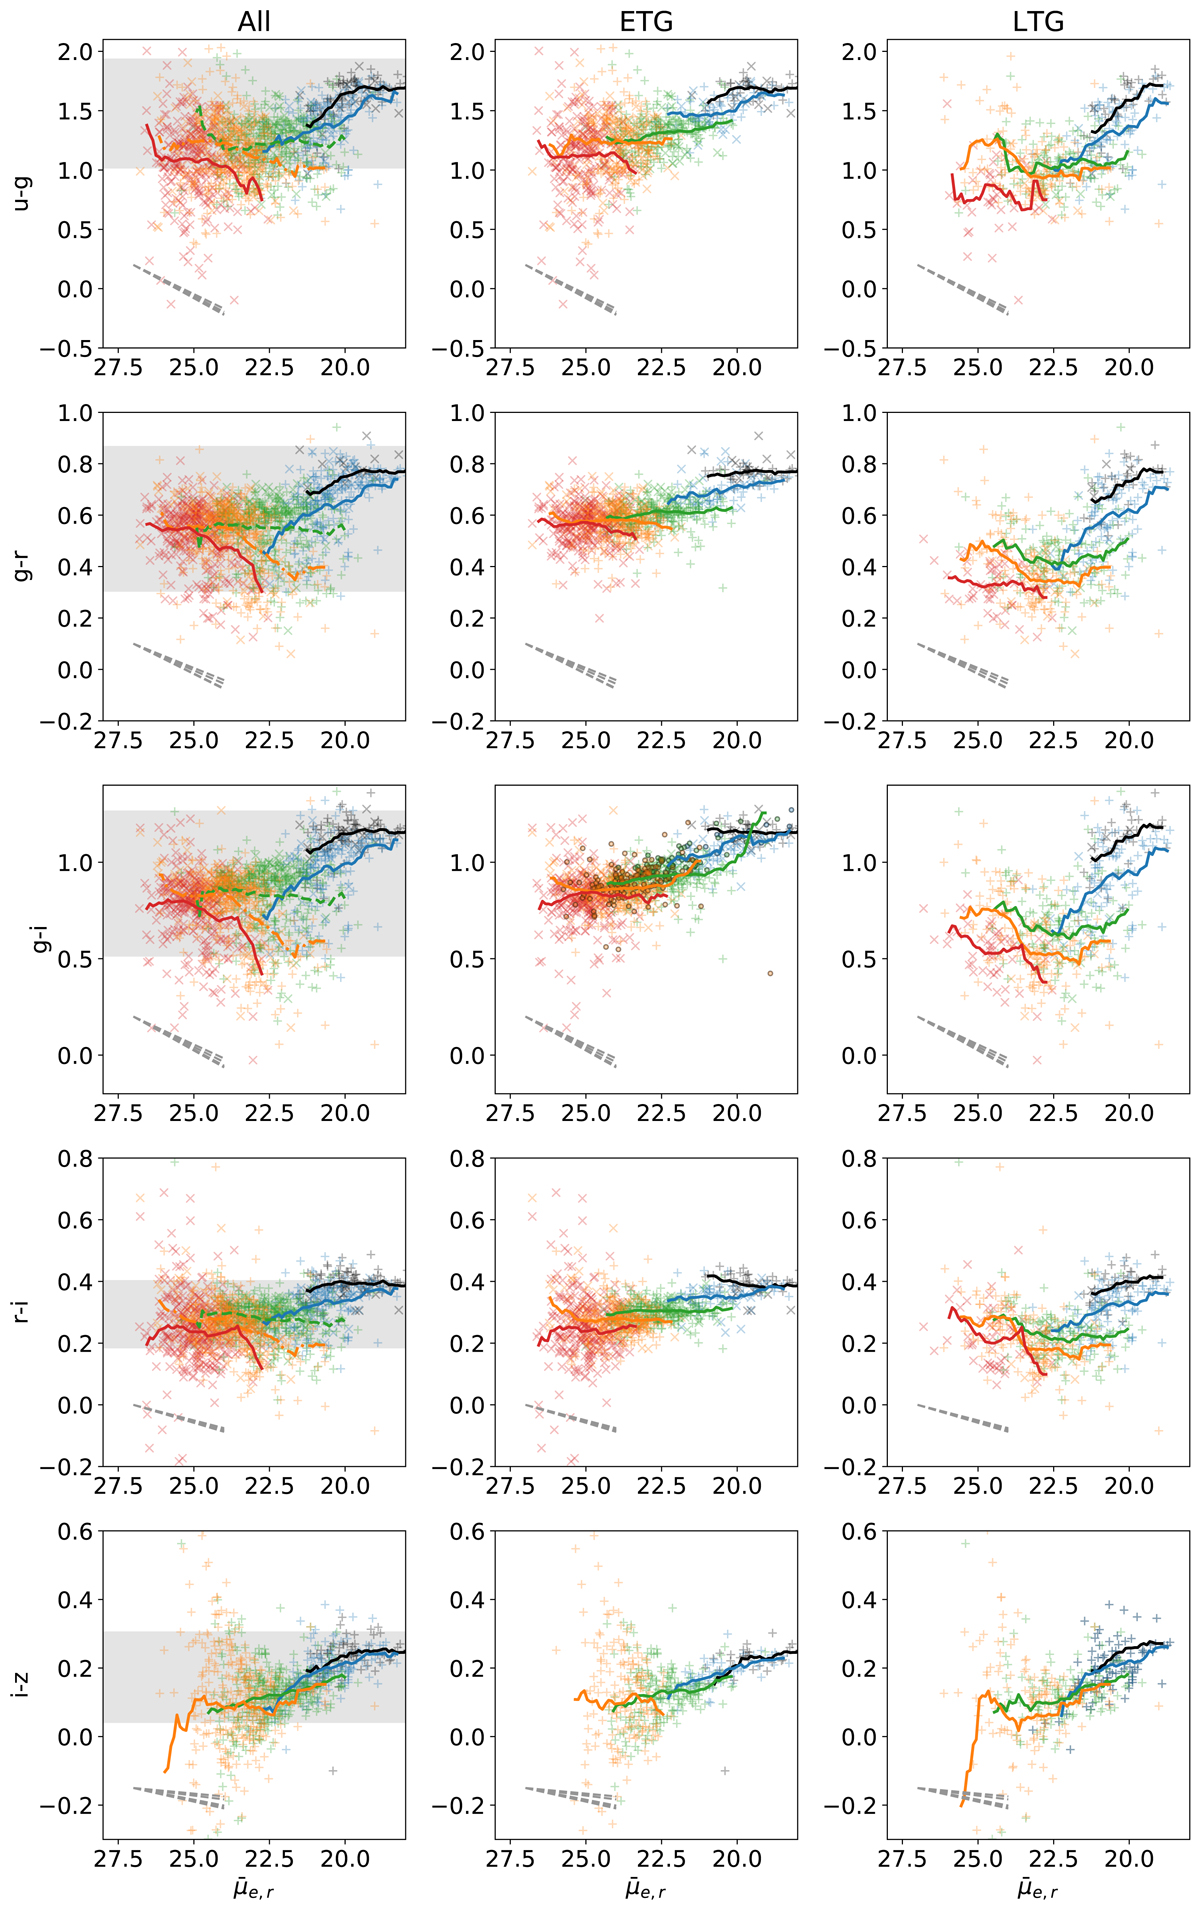
Colour versus mean effective surface brightness; symbols and mass bins are the same as in Fig. 1. The galaxies for the Virgo and Fornax clusters are jointly analysed (left column), but ETGs (middle) and LTGs (right) are separated (symbols and colours as in Fig. 1; in the ETG panel for g − i, data for the Perseus cluster are added and displayed as circles; for a detailed view, see Fig. A.3). Different galaxy colours are shown in the various rows. In addition, the slopes of passively fading and reddening SSP models for a range of metallicities are indicated in the bottom left of each panel (see text and Fig. 3; for better readability, they are plotted at a position offset from the data); they are very similar for all metallicities in each panel. The y-ranges from Fig. 3 are shaded in grey in the left panels for reference. While the characteristic change of the average slope across the mass bins can be seen for the LTGs, the ETGs show only a mild (or no) variation. The slope for the low-mass LTGs is largely consistent with the SSP models.
Current usage metrics show cumulative count of Article Views (full-text article views including HTML views, PDF and ePub downloads, according to the available data) and Abstracts Views on Vision4Press platform.
Data correspond to usage on the plateform after 2015. The current usage metrics is available 48-96 hours after online publication and is updated daily on week days.
Initial download of the metrics may take a while.