Fig. 3.
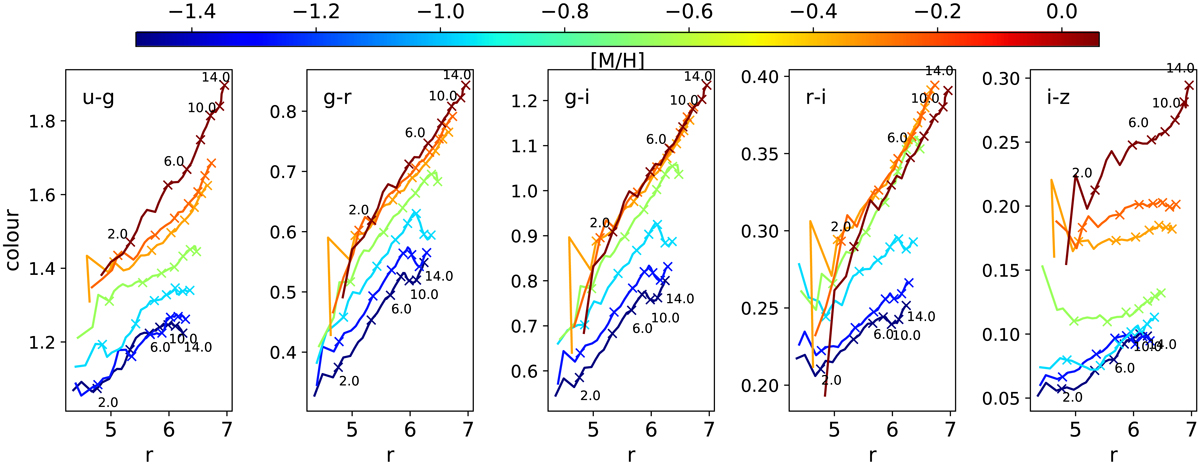
Predictions of how passively evolving single stellar population (SSPs) fade and redden. The different panels show various colours based on SDSS filters (see the top left label in each panel) for time steps corresponding to ages older than 1 Gyr. The SSP models’ predictions (see text) are shown for a range of metallicities from [M/H] = −1.5 to solar (see colour bar on top; [M/H] = 0 corresponds to a 2% mass fraction of the metals), and the ages are marked in steps of 2 Gyr (see also the numbers in the panels above and below the model lines). In our analysis, we compare the slopes of the lines (fitted over an age range of 2−12 Gyr; see the table in the appendix) to the observations. In each panel, the slopes are similar for different metallicities. It can also be seen that the absolute value of the colour is determined by the metallicity and age of the stellar population. The magnitudes are normalised per unit solar mass of the initial stellar population. For unchanged physical sizes of the galaxies, differences in magnitudes in the brightness correspond to differences in surface brightness.
Current usage metrics show cumulative count of Article Views (full-text article views including HTML views, PDF and ePub downloads, according to the available data) and Abstracts Views on Vision4Press platform.
Data correspond to usage on the plateform after 2015. The current usage metrics is available 48-96 hours after online publication and is updated daily on week days.
Initial download of the metrics may take a while.