Fig. 2.
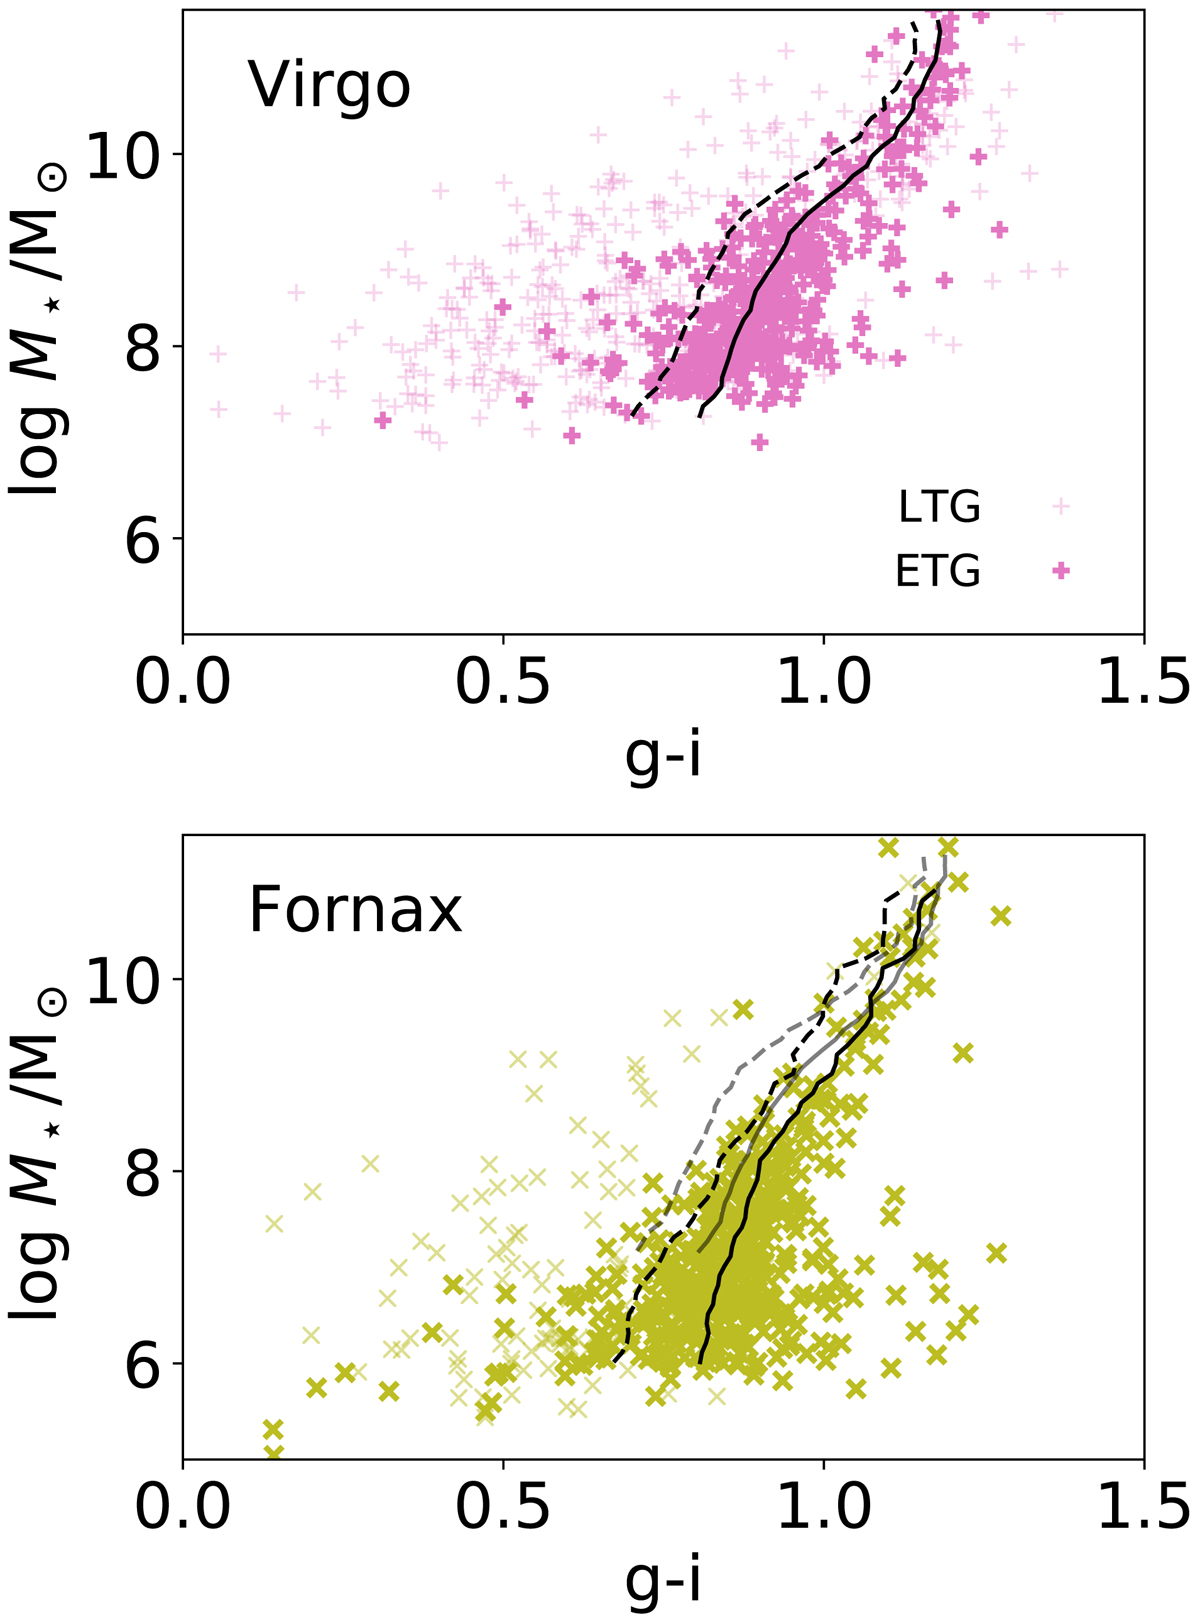
Stellar mass versus g − i colour relations for galaxies in the Virgo (top) and Fornax (bottom) clusters (for other colours, see Fig. C.1). The solid black lines show the running mean relations (in M⋆ with a bin width of 1 dex) for the ETGs (bold symbols), while the dashed lines indicate the mean minus one σ. The Virgo relations are shown (in grey) in the lower panel for reference. The relations are largely consistent for the Fornax and Virgo clusters.
Current usage metrics show cumulative count of Article Views (full-text article views including HTML views, PDF and ePub downloads, according to the available data) and Abstracts Views on Vision4Press platform.
Data correspond to usage on the plateform after 2015. The current usage metrics is available 48-96 hours after online publication and is updated daily on week days.
Initial download of the metrics may take a while.