Fig. C.1.
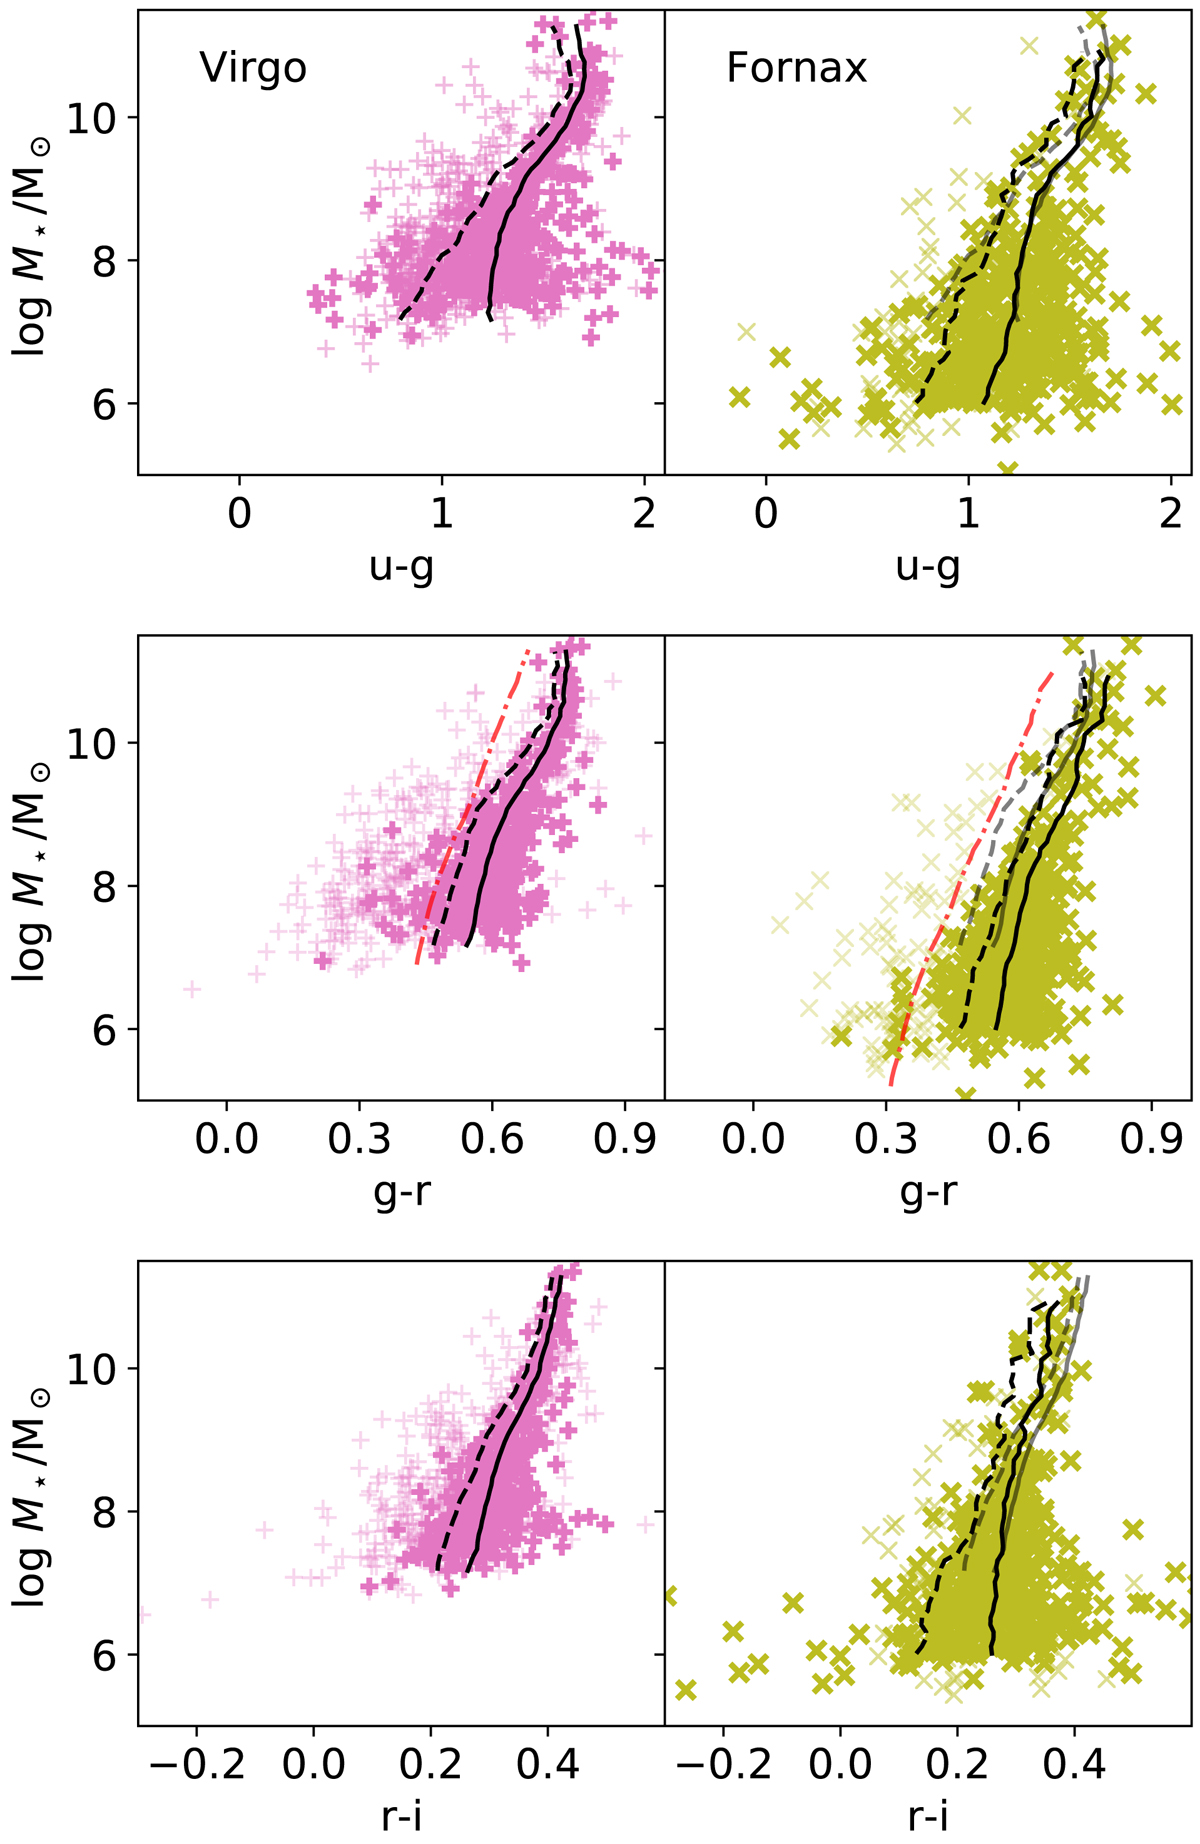
As in Fig. 2, stellar mass versus colour relations for galaxies in the Virgo (left) and Fornax (right) clusters. The red curve in the panels with g − r illustrates the dividing line for the red fraction, according to Weinmann et al. (2011, to illustrate their linear relation as a function of total magnitude in this figure, the stellar masses were converted to r-band brightnesses using a running mean average relation). The relations are largely consistent for both clusters.
Current usage metrics show cumulative count of Article Views (full-text article views including HTML views, PDF and ePub downloads, according to the available data) and Abstracts Views on Vision4Press platform.
Data correspond to usage on the plateform after 2015. The current usage metrics is available 48-96 hours after online publication and is updated daily on week days.
Initial download of the metrics may take a while.