Fig. B.2.
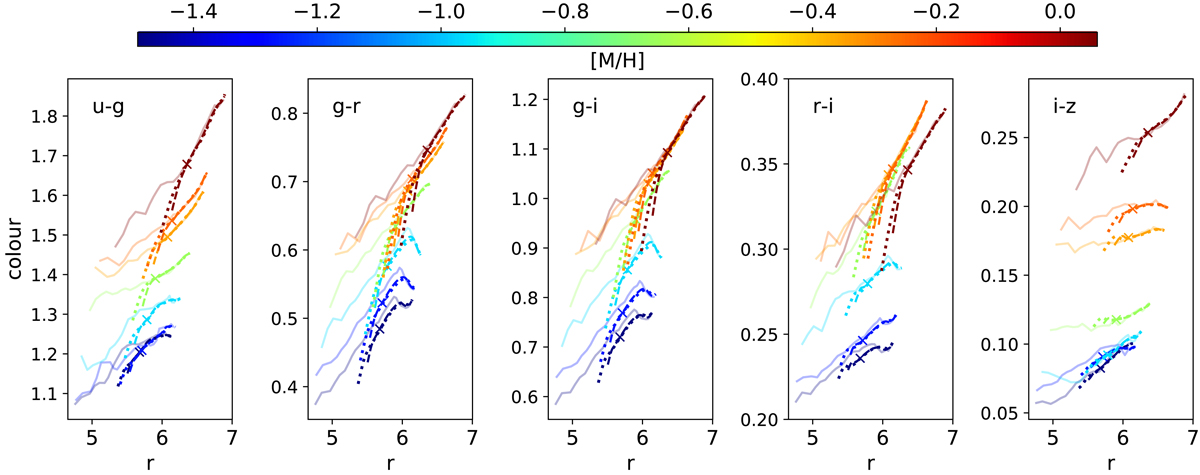
Comparison of colours and brightnesses of galaxies with complex stellar populations (CSP; see Fig. B.1) with the same present-day stellar mass but different truncation times. This figure, for the CSP, corresponds to Fig. 3 for the SSP models. The solid pale lines reproduce these SSP relations for ages between 2 and 12 Gyr, the range over which the slopes have been fitted. The dotted and dashed lines show the curves for models with more complex star formation histories (constant and exponentially declining, respectively; see text) with truncation times between 0.5 and 12 Gyr ago. The resulting slopes are largely consistent with those of the SSP, with a steeper slope at truncation ages younger than 2 Gyr (marked with crosses).
Current usage metrics show cumulative count of Article Views (full-text article views including HTML views, PDF and ePub downloads, according to the available data) and Abstracts Views on Vision4Press platform.
Data correspond to usage on the plateform after 2015. The current usage metrics is available 48-96 hours after online publication and is updated daily on week days.
Initial download of the metrics may take a while.