Fig. B.1.
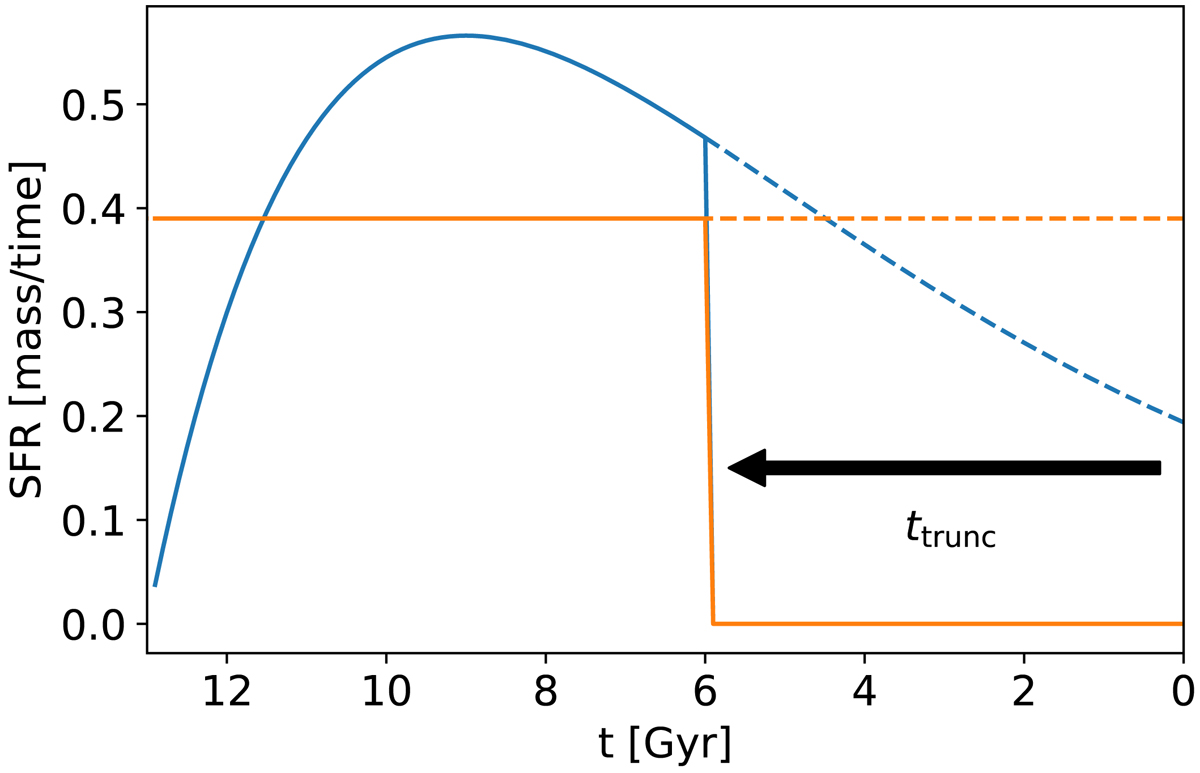
Illustration of the considered (complex) star formation histories: an exponentially declining star formation rate (blue) and a constant star formation rate, each truncated by the interaction with the cluster at ttrunc. Here the times correspond to lookback times, and τ = 4 Gyr for the exponentially declining model. An arbitrary normalisation is applied to the y-axis for better readability.
Current usage metrics show cumulative count of Article Views (full-text article views including HTML views, PDF and ePub downloads, according to the available data) and Abstracts Views on Vision4Press platform.
Data correspond to usage on the plateform after 2015. The current usage metrics is available 48-96 hours after online publication and is updated daily on week days.
Initial download of the metrics may take a while.