Fig. 1.
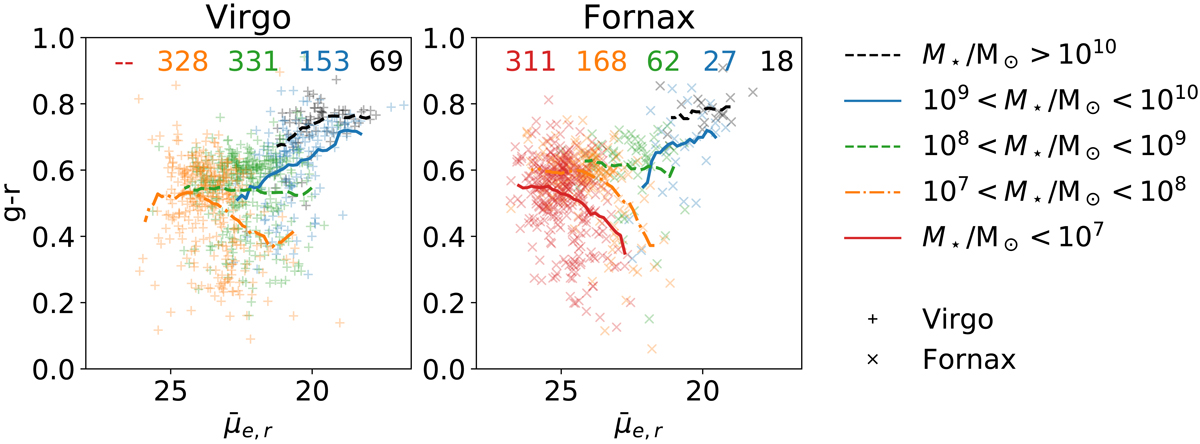
Mean effective surface brightness versus g − r colour for cluster galaxies separated into stellar mass bins, for the Virgo (left panel) and Fornax (right panel) galaxy clusters. The numbers above the points quantify the sizes of the sub-samples. The curves display the running means of the relation in the mass bins indicated on the right, with a window width of 1 mag arcsec−2. The symbols, mass bins, and running means will also be used in subsequent figures. Overall, the general trend of a change in the slope of the averaged data is found for both clusters. At low mass, the correlation of low surface brightness with redness was interpreted as a result of fading and reddening after the star formation is quenched (Venhola et al. 2019).
Current usage metrics show cumulative count of Article Views (full-text article views including HTML views, PDF and ePub downloads, according to the available data) and Abstracts Views on Vision4Press platform.
Data correspond to usage on the plateform after 2015. The current usage metrics is available 48-96 hours after online publication and is updated daily on week days.
Initial download of the metrics may take a while.