Free Access
Fig. B.1
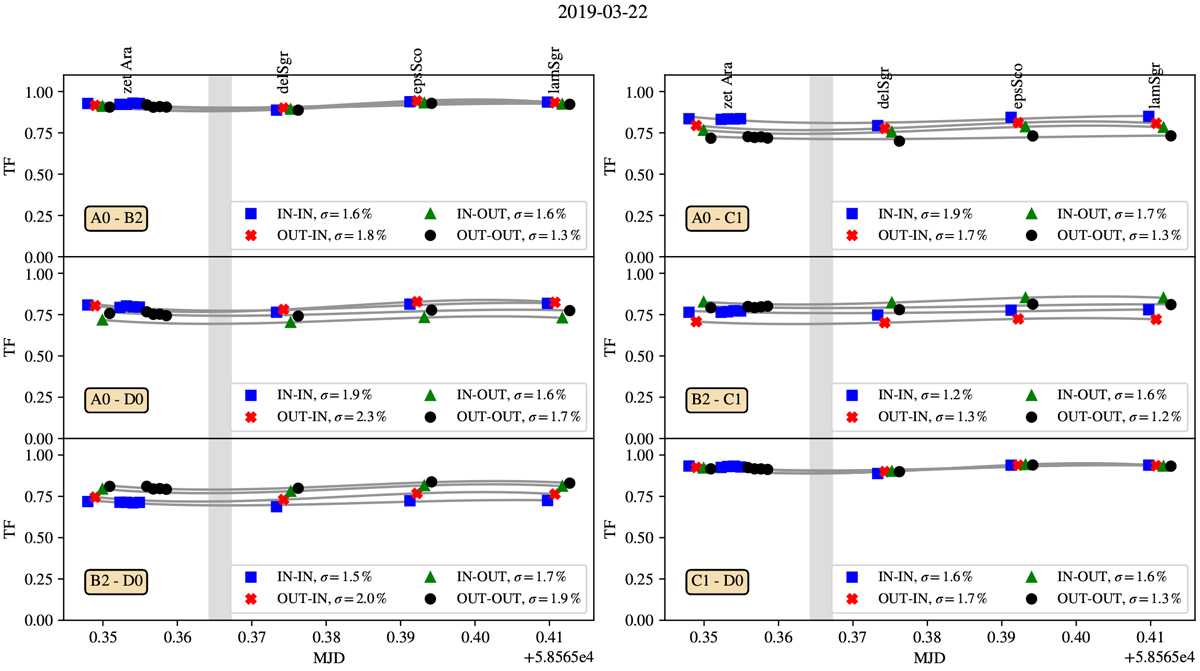
L-band transfer function during the night from 2019-03-22 to 2019-03-23. Gray shading indicates the observation time of HD 163296.The gray lines, one for each BCD configuration, are cubic polynomial fits to the points. In the captions, σ is the relative standard deviation of the transfer function values.
Current usage metrics show cumulative count of Article Views (full-text article views including HTML views, PDF and ePub downloads, according to the available data) and Abstracts Views on Vision4Press platform.
Data correspond to usage on the plateform after 2015. The current usage metrics is available 48-96 hours after online publication and is updated daily on week days.
Initial download of the metrics may take a while.