Fig. 7
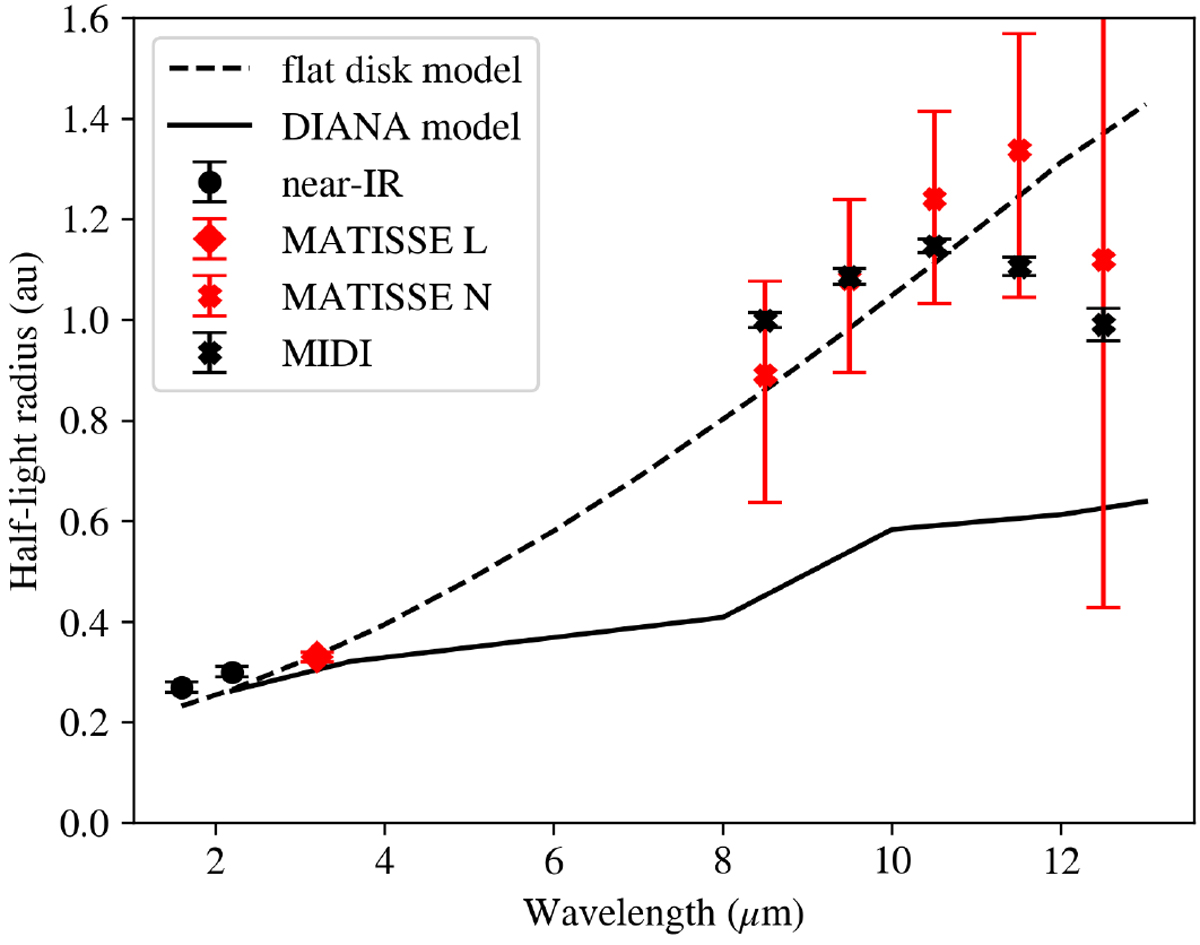
Characteristic size of the emitting region as function of wavelength. The red points are derived from our MATISSE data. The 1.6 and 2.2 μm points come from PIONIER (Lazareff et al. 2017; Kluska et al. 2020) and GRAVITY (GRAVITY Collaboration 2019) observations, respectively. Black crosses represent our new fits to MIDI data published by Varga et al. (2018). The solid line is from the DIANA radiative transfer model of HD 163296 (Woitke et al. 2019). The dashed line corresponds to our flat diskmodel.
Current usage metrics show cumulative count of Article Views (full-text article views including HTML views, PDF and ePub downloads, according to the available data) and Abstracts Views on Vision4Press platform.
Data correspond to usage on the plateform after 2015. The current usage metrics is available 48-96 hours after online publication and is updated daily on week days.
Initial download of the metrics may take a while.