Fig. 3
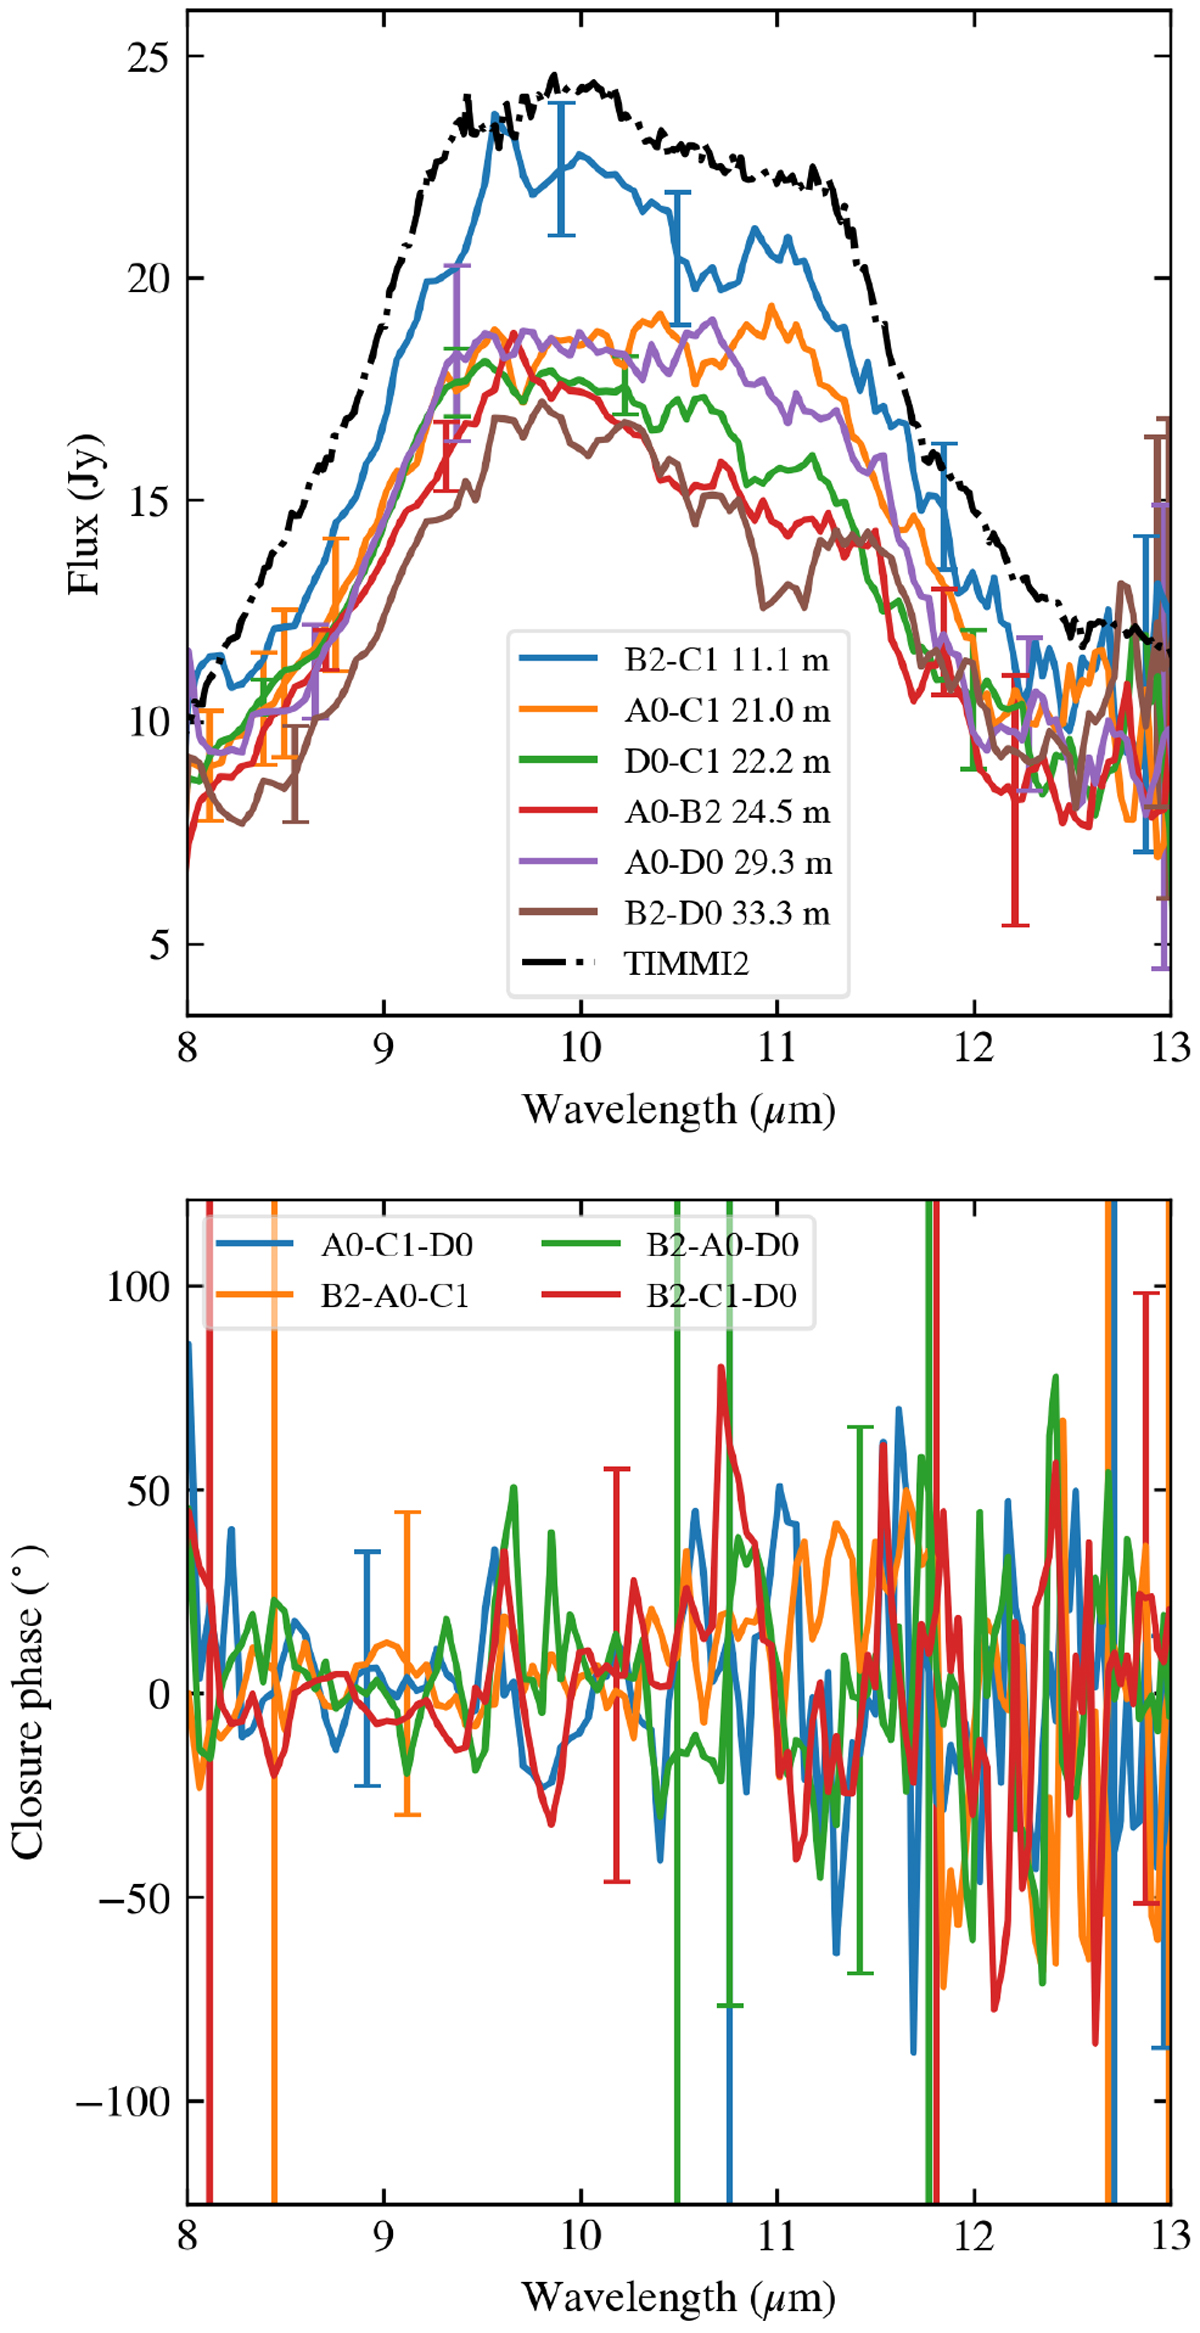
Final N-band calibrated data products from the 2019 March observation (solid lines): correlated spectra (top), and closure phases (bottom). Error bars are indicated at a few random locations. For comparison, we plot the total spectrum on the top panel (dash-dot black line) measured with the TIMMI2 instrument (van Boekel et al. 2005b).
Current usage metrics show cumulative count of Article Views (full-text article views including HTML views, PDF and ePub downloads, according to the available data) and Abstracts Views on Vision4Press platform.
Data correspond to usage on the plateform after 2015. The current usage metrics is available 48-96 hours after online publication and is updated daily on week days.
Initial download of the metrics may take a while.