Free Access
Fig. 2
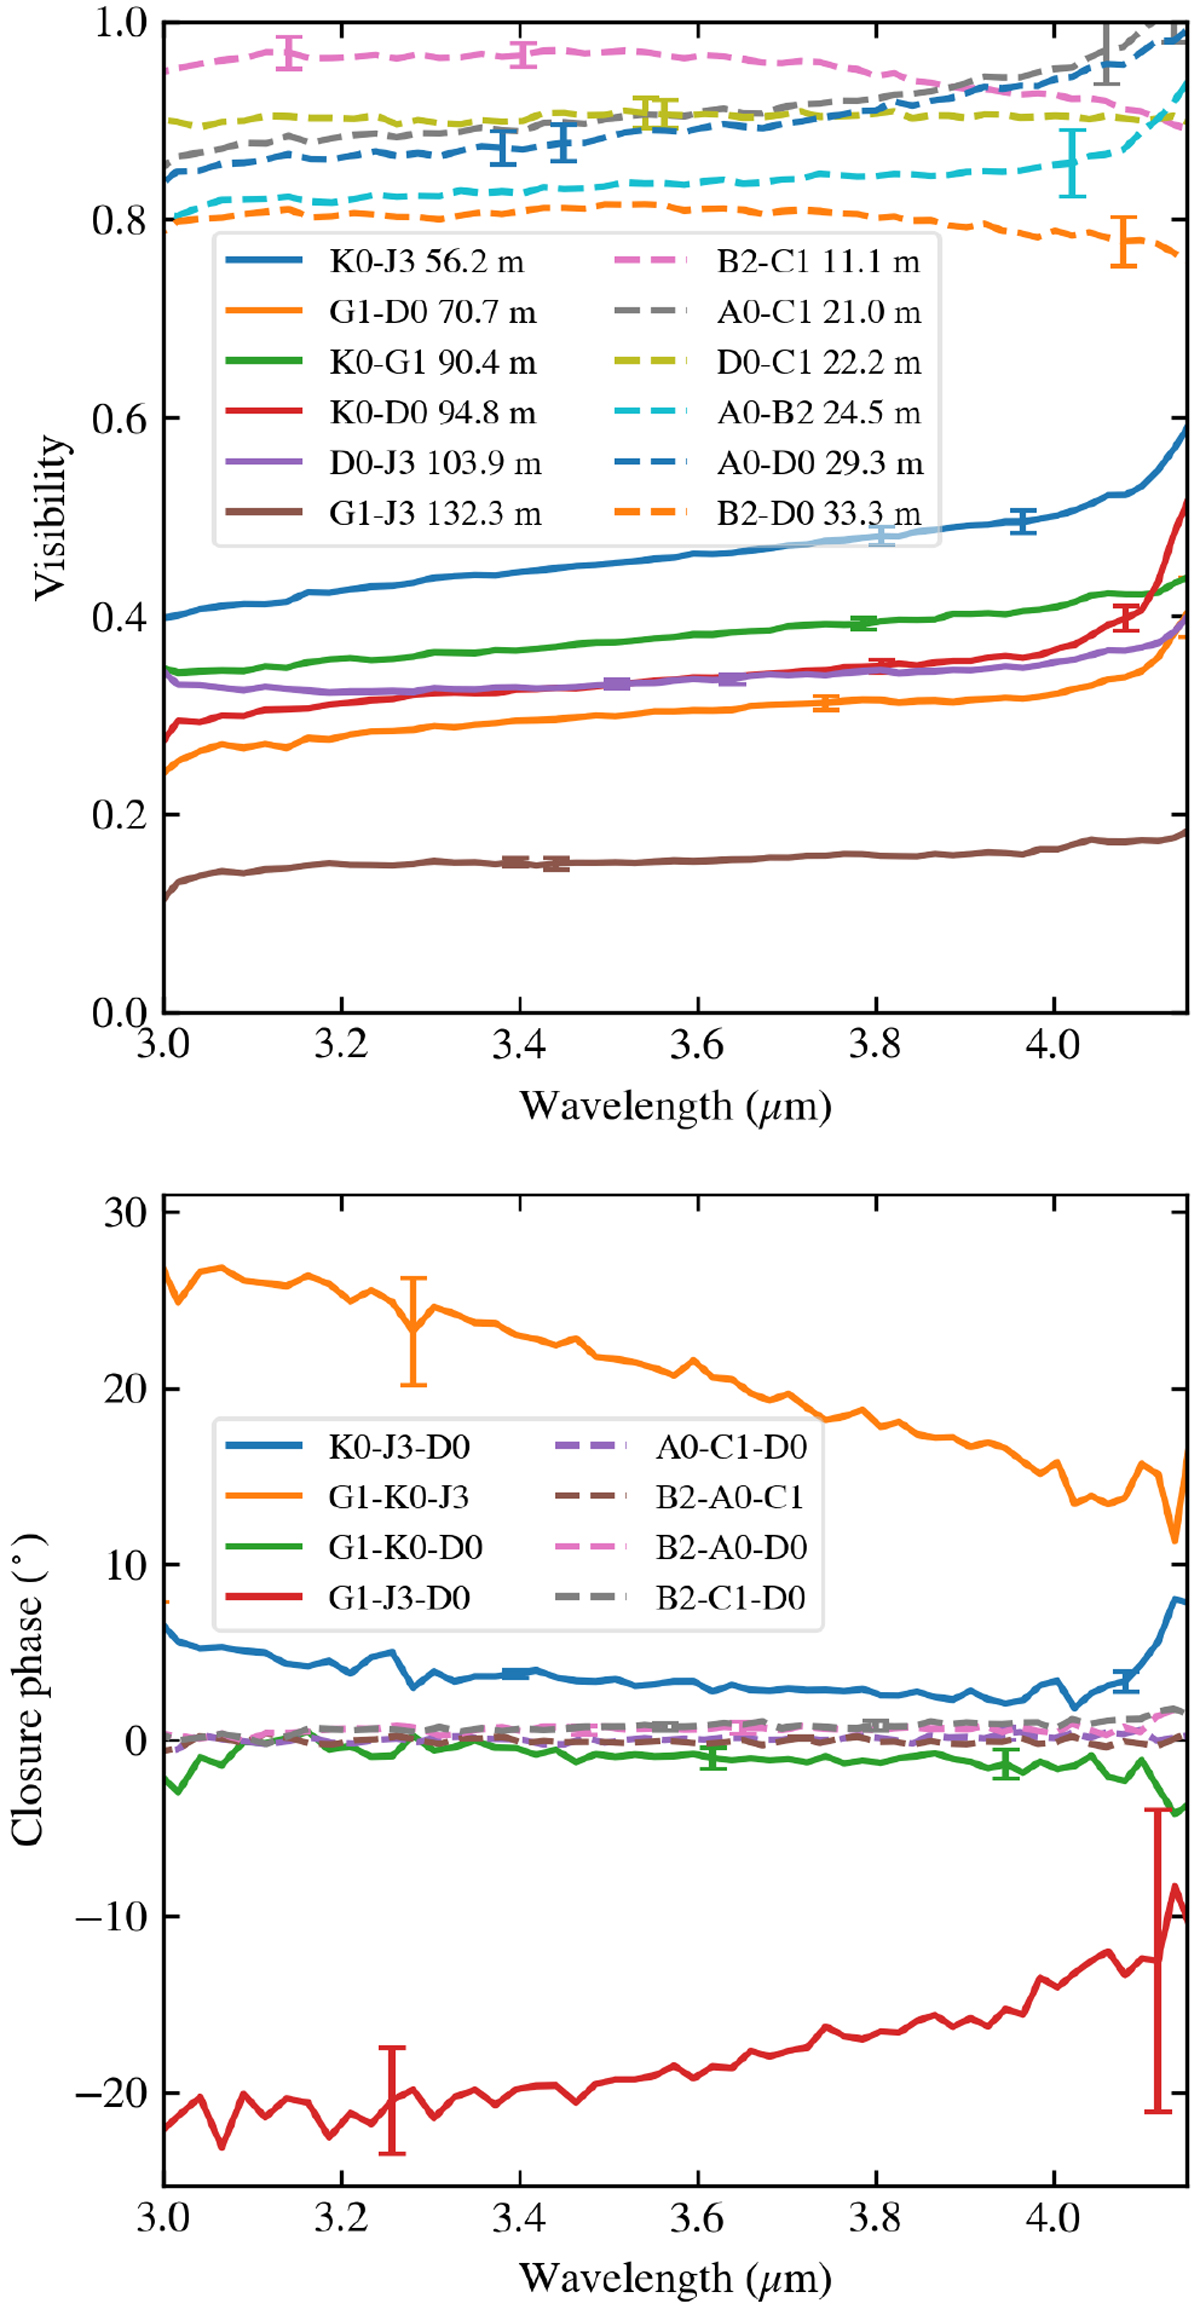
Final L-band calibrated data products from the 2019 March (dashed lines) and May (solid lines) observations: spectrally resolved absolute visibilities (top), and closure phases (bottom). Error bars are indicated at a few random locations.
Current usage metrics show cumulative count of Article Views (full-text article views including HTML views, PDF and ePub downloads, according to the available data) and Abstracts Views on Vision4Press platform.
Data correspond to usage on the plateform after 2015. The current usage metrics is available 48-96 hours after online publication and is updated daily on week days.
Initial download of the metrics may take a while.