Fig. 8
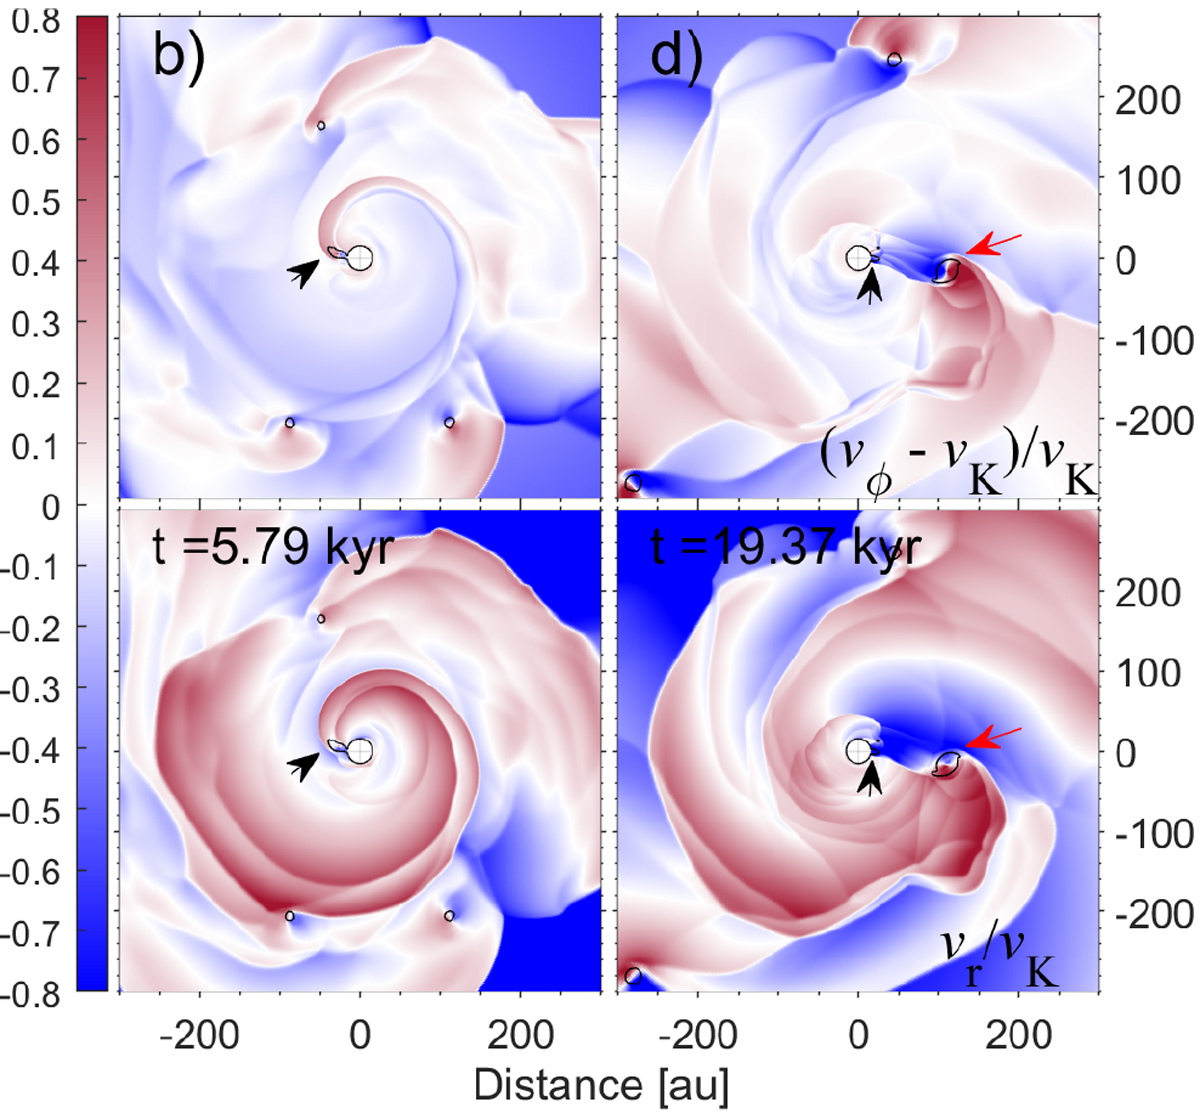
Spatial distributions of the residual azimuthal velocity δvϕ = (vϕ − vK)∕vK (top panels) and the ratio of radial to Keplerian velocity δvr = vr∕vK (bottom panels) in the clump-infall model. Left and right columns correspond to the time instances during the Clump2 and Clump3 bursts, which are marked in the right column of Fig. 7 as (b) and (d). The black contour lines outlinethe clumps, the black arrows point to the position of the clump that causes the burst, while the red arrows indicate the position of the clump that participated in the close encounter (but did not migrate to the star). The white circles in the coordinate center represent the sink cell. The disk rotates counterclockwise.
Current usage metrics show cumulative count of Article Views (full-text article views including HTML views, PDF and ePub downloads, according to the available data) and Abstracts Views on Vision4Press platform.
Data correspond to usage on the plateform after 2015. The current usage metrics is available 48-96 hours after online publication and is updated daily on week days.
Initial download of the metrics may take a while.