Fig. 7
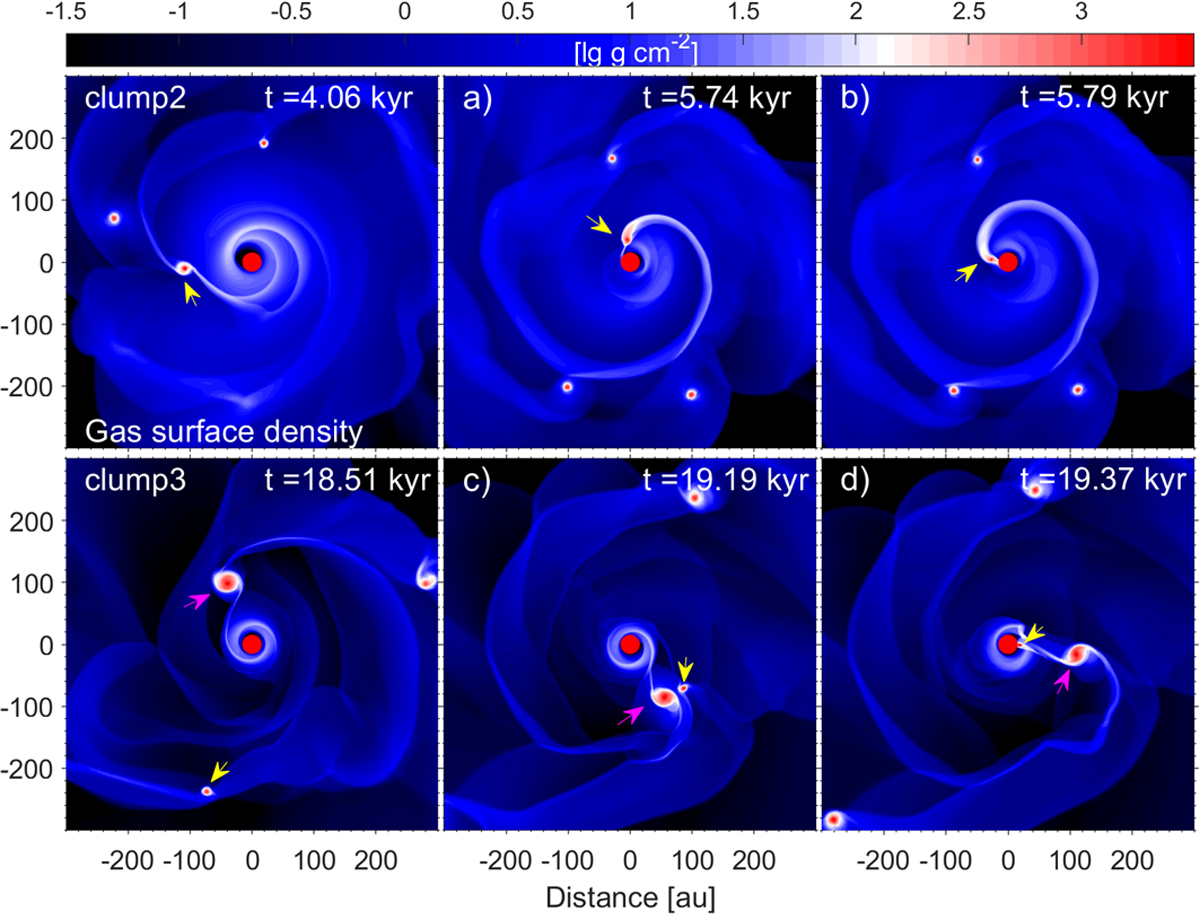
Gas surface density maps in the inner 600 × 600 au2 box in the clump-infall model. Top and bottom rows: disk structure corresponding to the Clump2 and Clump3 bursts in the second and third rows of Fig. 1. First and second columns (from left to right): time instances preceding the burst, while third column: disk during the burst. The yellow arrows show the positions of perturbed clumps that fall onto the central star, while the red arrows indicate the clump that is involved in the close encounter. The disk is rotating counterclockwise.
Current usage metrics show cumulative count of Article Views (full-text article views including HTML views, PDF and ePub downloads, according to the available data) and Abstracts Views on Vision4Press platform.
Data correspond to usage on the plateform after 2015. The current usage metrics is available 48-96 hours after online publication and is updated daily on week days.
Initial download of the metrics may take a while.