Fig. 6
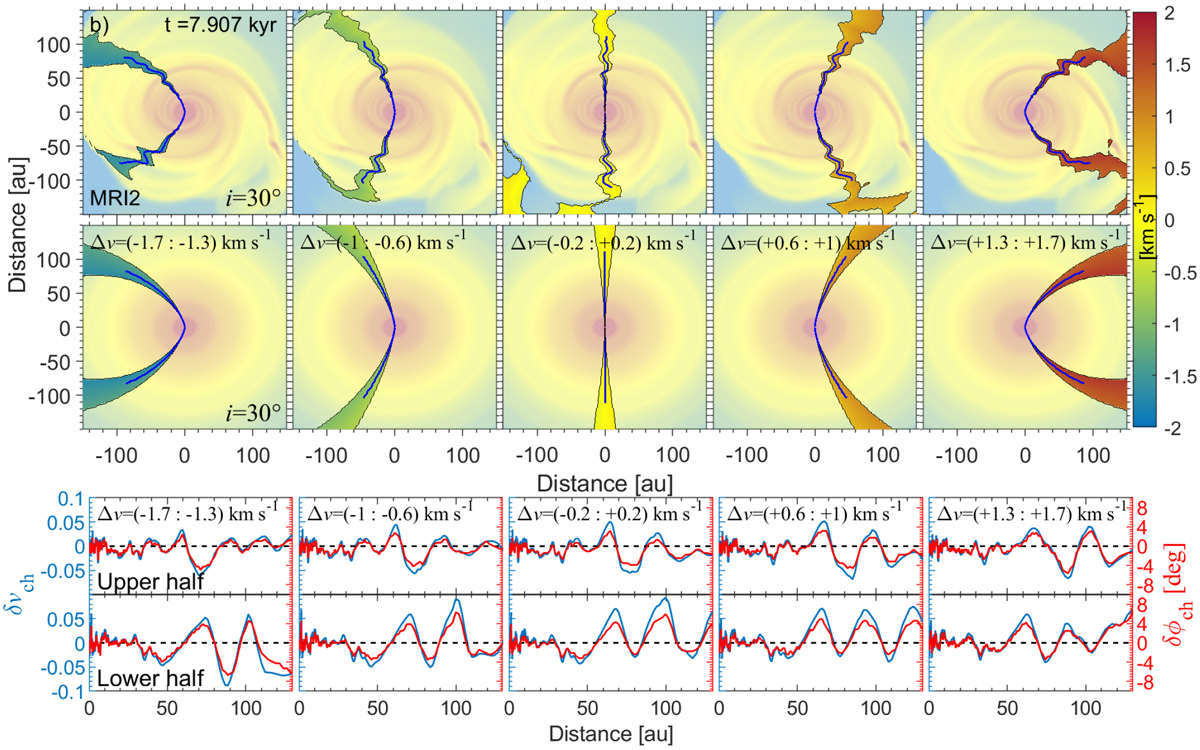
Line-of-sight velocity channel maps in the disk of the MRI model near the burst maximum (top row) vs. those of an idealized Keplerian disk (middle row). The disks are tilted by 30° with respect to the horizontal axis with the upper part being further out from the observer. The color bar presents the deviation from the zero-velocity in km s−1. Each channel shows a velocity interval of 0.4 km s−1. The corresponding gas surface density maps are plotted in pale palette for convenience. The rotation is counterclockwise. Bottom row: deviations in the position angle (δϕch) and velocity (δvch) of the center of each velocity channel in the MRI model with respect to the center of the corresponding channel in the Keplerian disk. The centers of the model and Keplerian channels are shown by the blue curves in the top and middle panels for convenience. The values for the upper and lower halves of the disk are shown separately.
Current usage metrics show cumulative count of Article Views (full-text article views including HTML views, PDF and ePub downloads, according to the available data) and Abstracts Views on Vision4Press platform.
Data correspond to usage on the plateform after 2015. The current usage metrics is available 48-96 hours after online publication and is updated daily on week days.
Initial download of the metrics may take a while.