Fig. 5
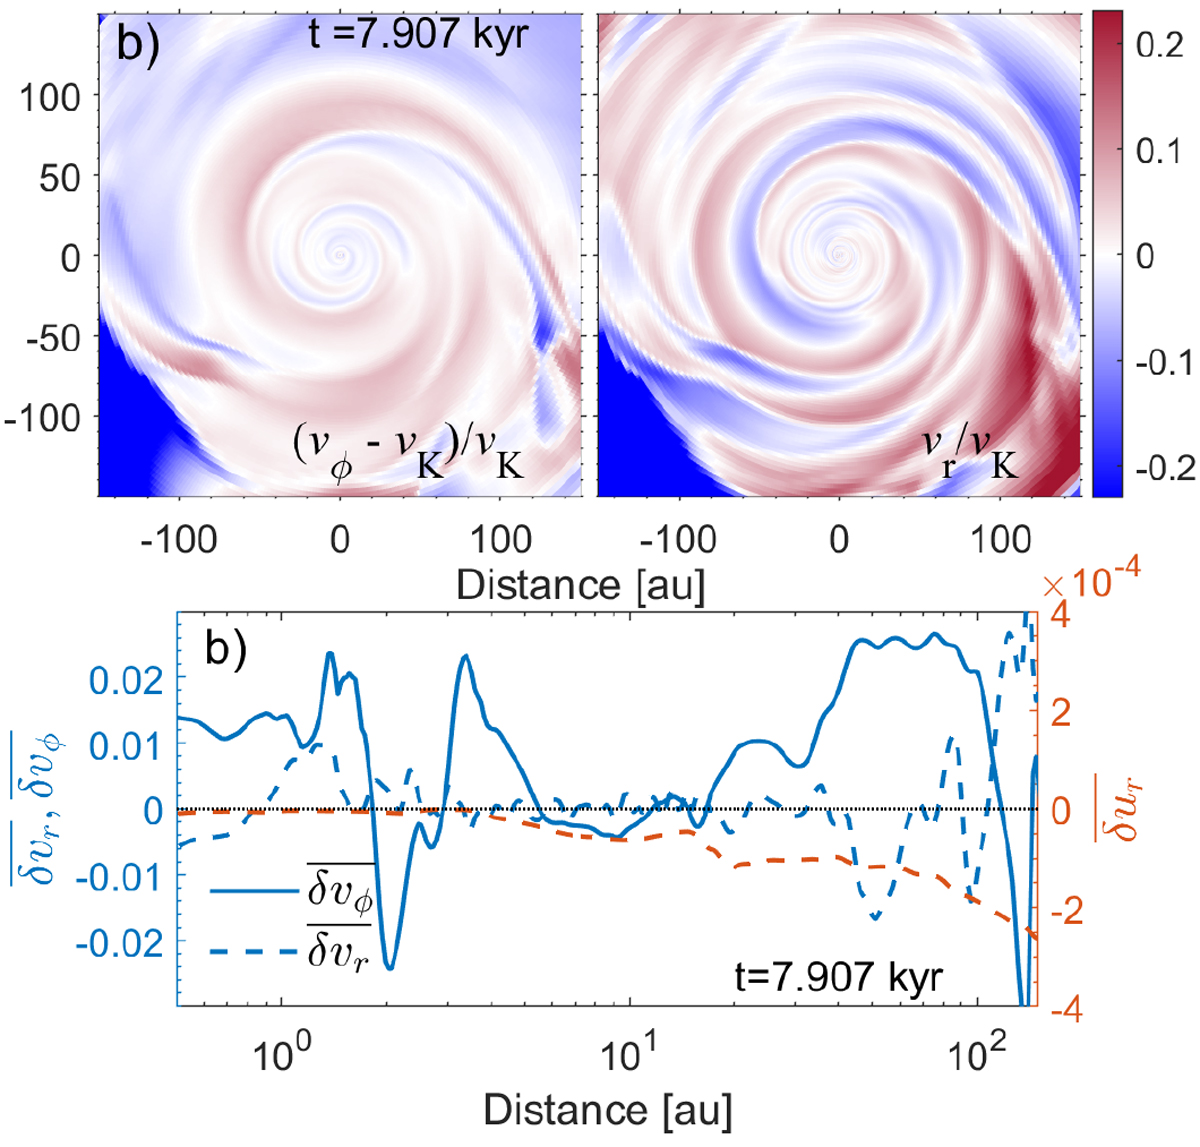
Top panels: spatial distributions of the residual azimuthal velocity δvϕ = (vϕ − vK)∕vK and the ratioof radial to Keplerian velocity δvr = vr∕vK in the MRI model. The data correspond to the time instance near the peak of the MRI1 burst marked in the top panel of Fig. 2 with the vertical dotted line (b). The white circles in the coordinate center represent the sink cell. The disk rotates counterclockwise. Bottom panel: corresponding azimuthally averaged radial profiles of residual velocity δvϕ and ratio δvr. The red dashed line shows the ratio of radial to Keplerian velocity δur = ur∕vK for an idealized steady-state disk at the time instance immediately preceding the burst.
Current usage metrics show cumulative count of Article Views (full-text article views including HTML views, PDF and ePub downloads, according to the available data) and Abstracts Views on Vision4Press platform.
Data correspond to usage on the plateform after 2015. The current usage metrics is available 48-96 hours after online publication and is updated daily on week days.
Initial download of the metrics may take a while.