Free Access
Fig. 4
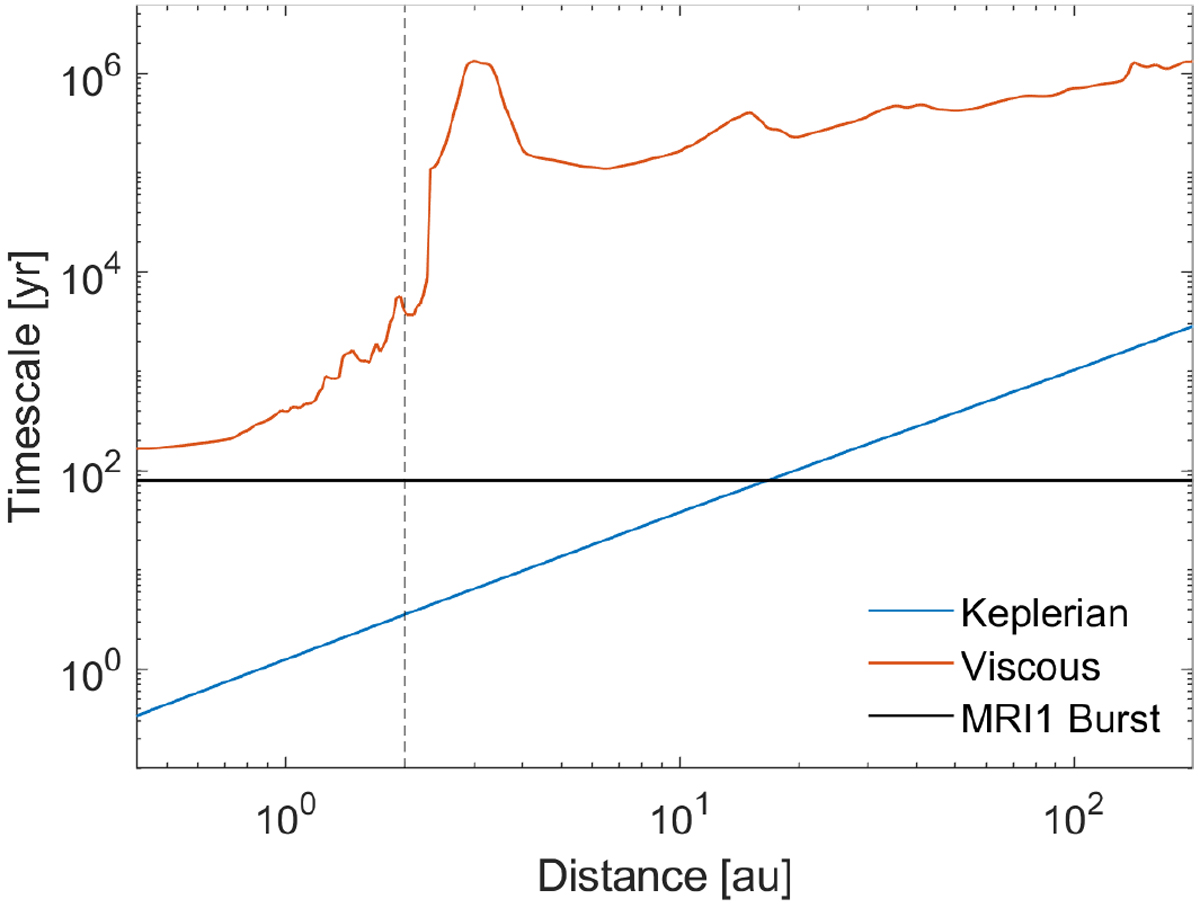
Comparison of the relevant timescales in the disk during the MRI1 burst. The red and blue lines present the viscous and dynamical timescales, respectively, while the black line shows the duration of the burst. The vertical dotted line outlinesthe extent of the MRI-active inner disk region.
Current usage metrics show cumulative count of Article Views (full-text article views including HTML views, PDF and ePub downloads, according to the available data) and Abstracts Views on Vision4Press platform.
Data correspond to usage on the plateform after 2015. The current usage metrics is available 48-96 hours after online publication and is updated daily on week days.
Initial download of the metrics may take a while.