Fig. 3
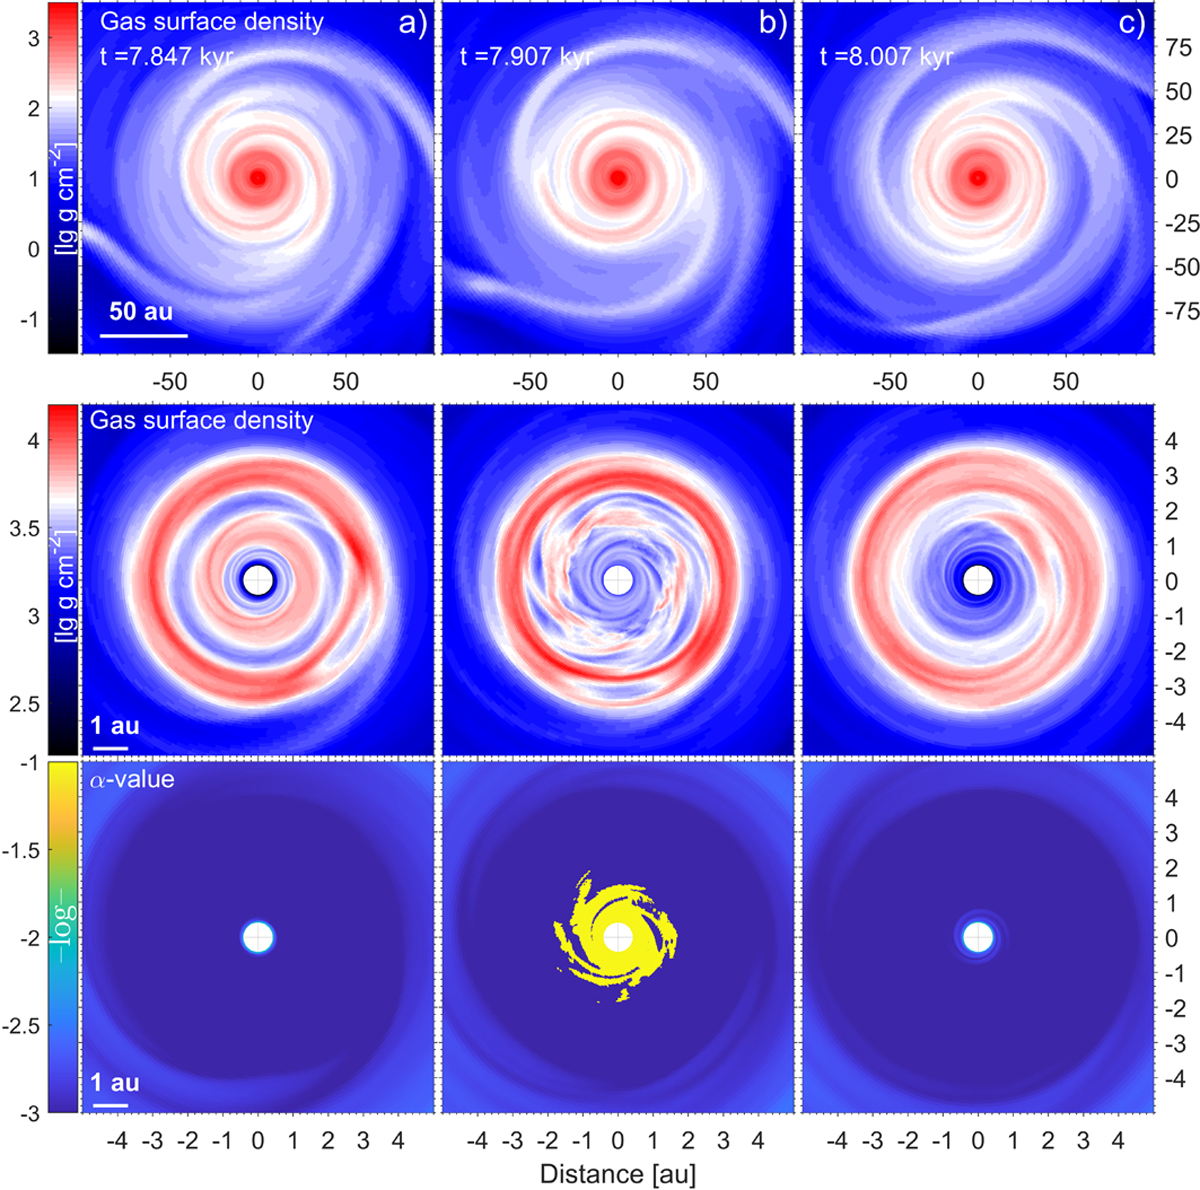
Disk properties before (left column), during (middle column), and after (right column) the MRI burst (MRI1). In particular, the columns from left to right correspond to the time instances marked in the top panel of Fig. 2 with the vertical dotted lines (a), (b), and (c), respectively. Top row: gas surface density maps in the inner 200 × 200 au2 box of the disk. Middle row: gas surface density in the inner 10 × 10 au2 part of the disk. Bottom row: value of α-parameter in the inner 10 × 10 au2 part of the disk. The white circles in the coordinate center represent the sink cell.
Current usage metrics show cumulative count of Article Views (full-text article views including HTML views, PDF and ePub downloads, according to the available data) and Abstracts Views on Vision4Press platform.
Data correspond to usage on the plateform after 2015. The current usage metrics is available 48-96 hours after online publication and is updated daily on week days.
Initial download of the metrics may take a while.