Free Access
Fig. 2
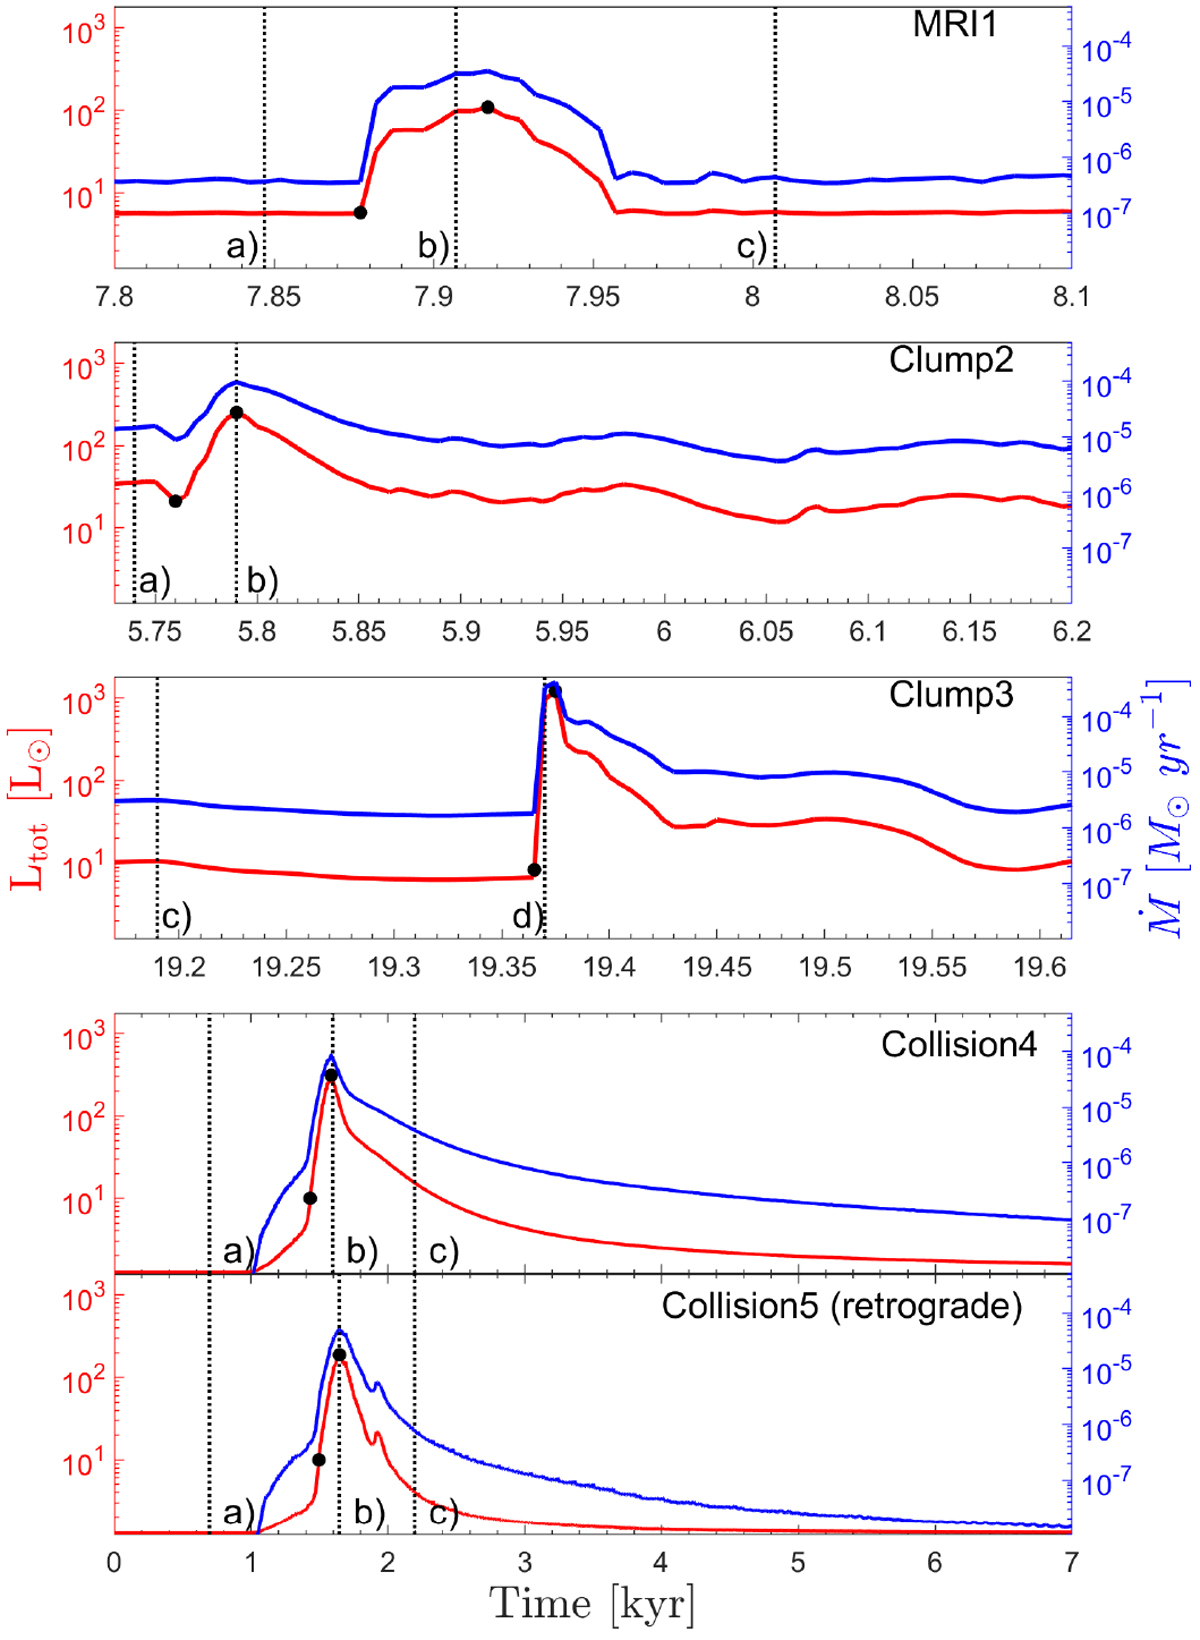
Temporal evolution of the accretion rate (blue lines) and total luminosity (red lines) for the five bursts indicated with arrowsin Fig. 1. The vertical black dotted lines marked with letters indicate the time instances studied in more detail further in this section.
Current usage metrics show cumulative count of Article Views (full-text article views including HTML views, PDF and ePub downloads, according to the available data) and Abstracts Views on Vision4Press platform.
Data correspond to usage on the plateform after 2015. The current usage metrics is available 48-96 hours after online publication and is updated daily on week days.
Initial download of the metrics may take a while.