Fig. 1
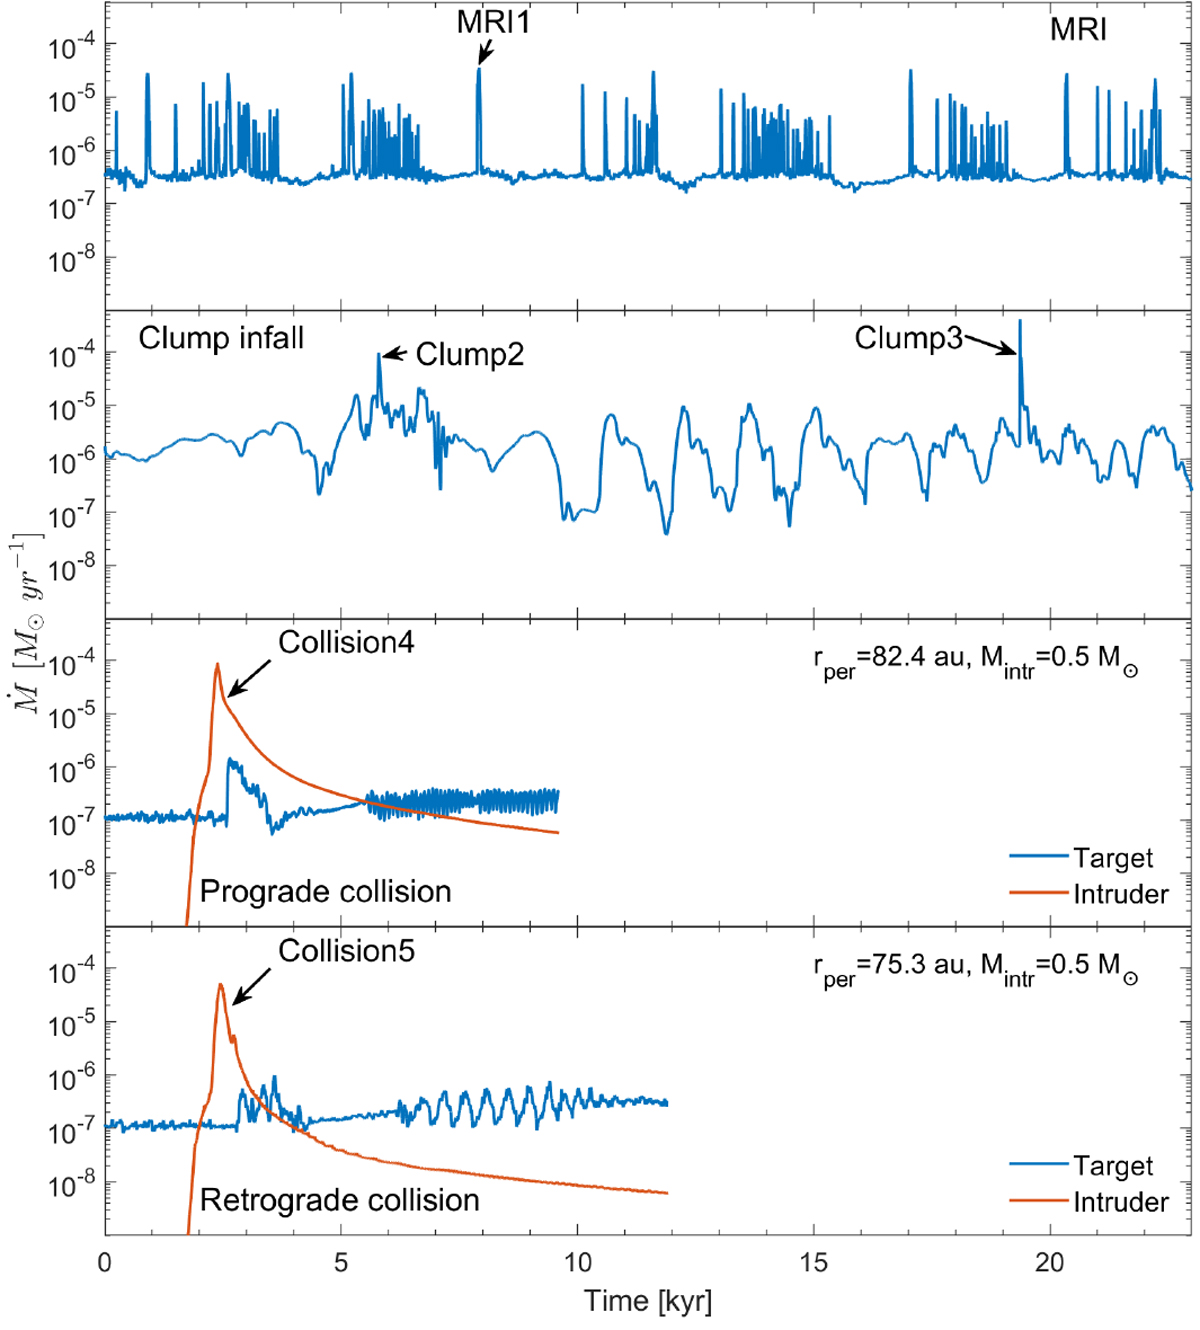
Accretion rate vs. time in the MRI model (top panel), clump-infall model (second panel), and collision model (third and forth panels). The collision model includes the cases of prograde (third panel) and retrograde (forth panel) collisions. In particular, the red and blue lines present the mass accretion rates on the intruder and target, respectively. The time is reset to zero for each chosen interval of disk evolution. The arrows indicate the bursts that are investigated in more detail below.
Current usage metrics show cumulative count of Article Views (full-text article views including HTML views, PDF and ePub downloads, according to the available data) and Abstracts Views on Vision4Press platform.
Data correspond to usage on the plateform after 2015. The current usage metrics is available 48-96 hours after online publication and is updated daily on week days.
Initial download of the metrics may take a while.