Fig. 3.
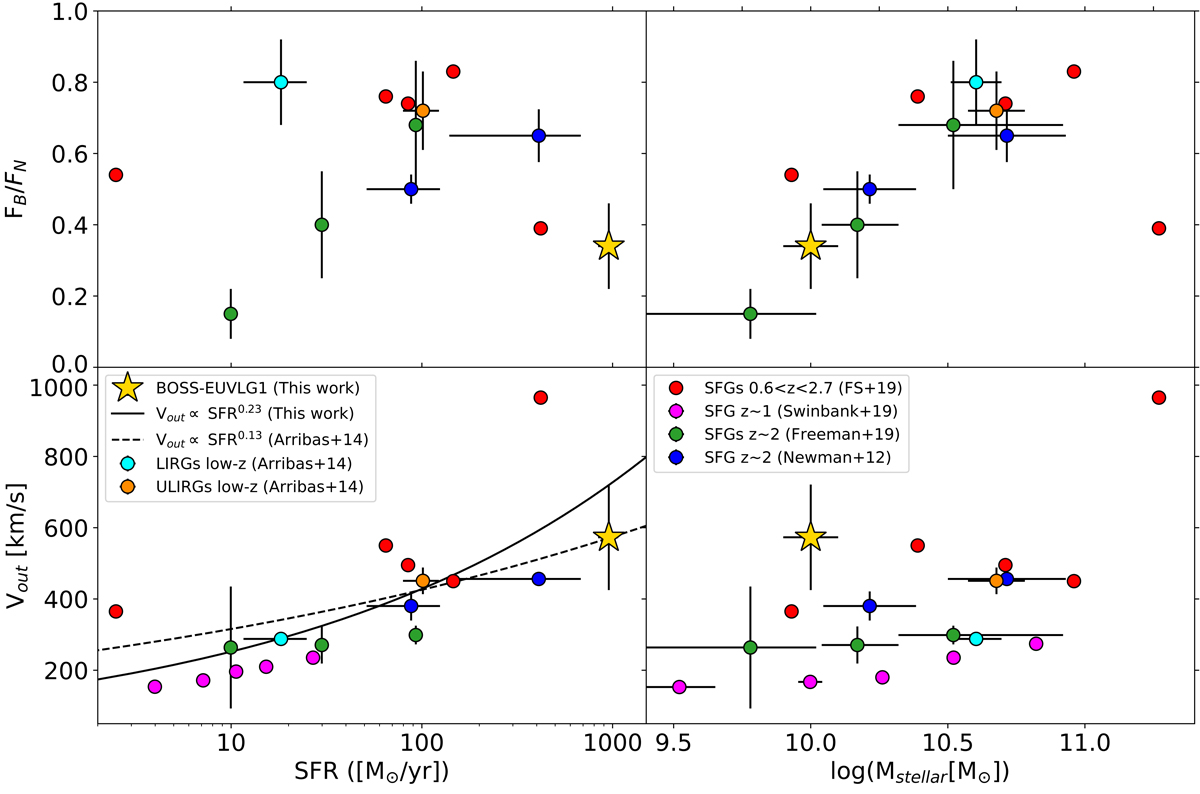
Observational properties of the ionized outflow in BOSS-EUVLG1 (yellow star) together with samples of star-forming galaxies (SFGs) at intermediate redshifts including 0.6 < z < 2.7 SFGs (red dots) from the KMOS3D survey (Förster Schreiber et al. 2019, values of Vout are a priv. comm.), SFGs at z ∼ 1 (magenta dots) from KMOS observations (Swinbank et al. 2019), SFGs at z ∼ 2 (green dots) from the MOSDEF survey Freeman et al. (2019), and SFGs at z∼2 (blue dots) from the SINS and zC-SINF surveys (Newman et al. 2012). Low-z (ultra-)luminous galaxies (cyan and orange dots) are also represented (Arribas et al. 2014). Upper panels: flux ratio of the broad to narrow Hα line components (FB/FN) as a function of the SFR (left) and Mstellar (right). Bottom panels: outflow velocity as a function of the SFR (left) and Mstellar (right). The continuum line in the Vout to SFR relation defines the best fit (Vout = 148 × SFR0.23) to the BOSS-EUVLG1, low- and intermediate-z data points. The dashed line represents the Vout to Hα-derived SFR relation derived for the low-z sample of U/LIRGs without AGNs (Arribas et al. 2014).
Current usage metrics show cumulative count of Article Views (full-text article views including HTML views, PDF and ePub downloads, according to the available data) and Abstracts Views on Vision4Press platform.
Data correspond to usage on the plateform after 2015. The current usage metrics is available 48-96 hours after online publication and is updated daily on week days.
Initial download of the metrics may take a while.