Fig. 2.
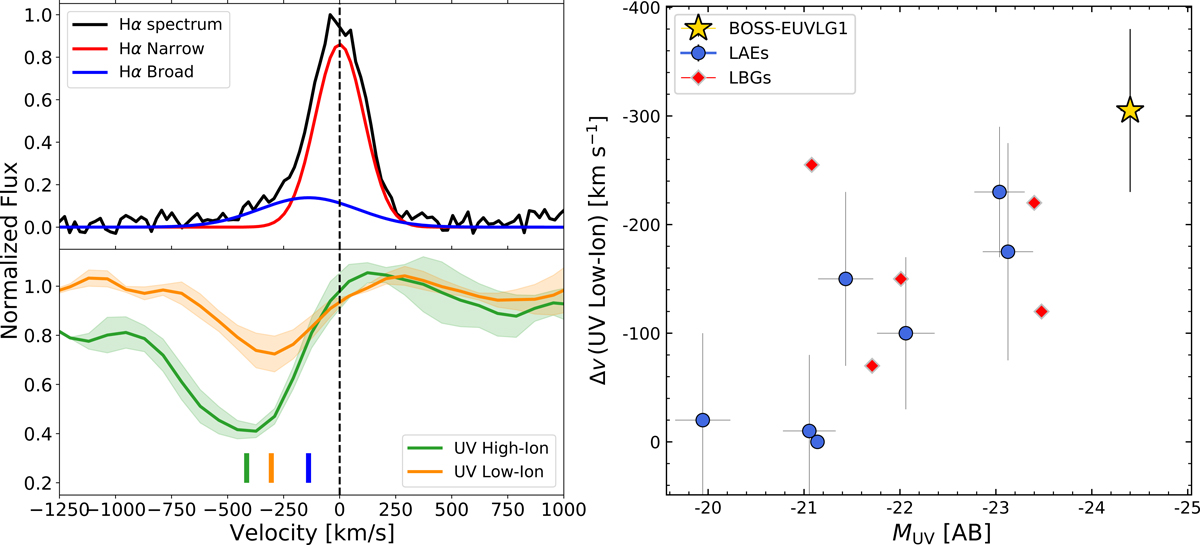
View of the UV absorption lines and the UV peak velocity of BOSS-EUVLG1. Left panel: comparison between the Hα emission and the UV ISM absorption lines. Upper left panel: normalized Hα spectrum (black line), together with the narrow (red line) and broad (blue line) Hα components. Bottom left panel: UV ISM absorption lines for two different ionization states. Orange line: combination of UV ISM absorption lines of partially neutral elements (Si II 1260 Å, C II 1334 Å, and Si II 1526 Å). Green line: combination of UV ISM absorption lines of high ionization elements (Si IV 1393,1402 Å). Both lines are normalized in a spectral windows clean of absorption and emission features. The peak velocities of both UV absorption ionization states and the broad Hα component are shown as color-coded vertical lines. Right panel: peak velocity of the UV low-ionization ISM absorption lines as a function of the UV absolute magnitude. Yellow star: BOSS-EUVLG1. Blue dots: Lyman alpha emitters (Patrício et al. 2016; Marques-Chaves et al. 2020b). Red squares: Lyman break galaxies (Pettini et al. 2000; Quider et al. 2009, 2010; Dessauges-Zavadsky et al. 2010; Marques-Chaves et al. 2018).
Current usage metrics show cumulative count of Article Views (full-text article views including HTML views, PDF and ePub downloads, according to the available data) and Abstracts Views on Vision4Press platform.
Data correspond to usage on the plateform after 2015. The current usage metrics is available 48-96 hours after online publication and is updated daily on week days.
Initial download of the metrics may take a while.