Fig. 1.
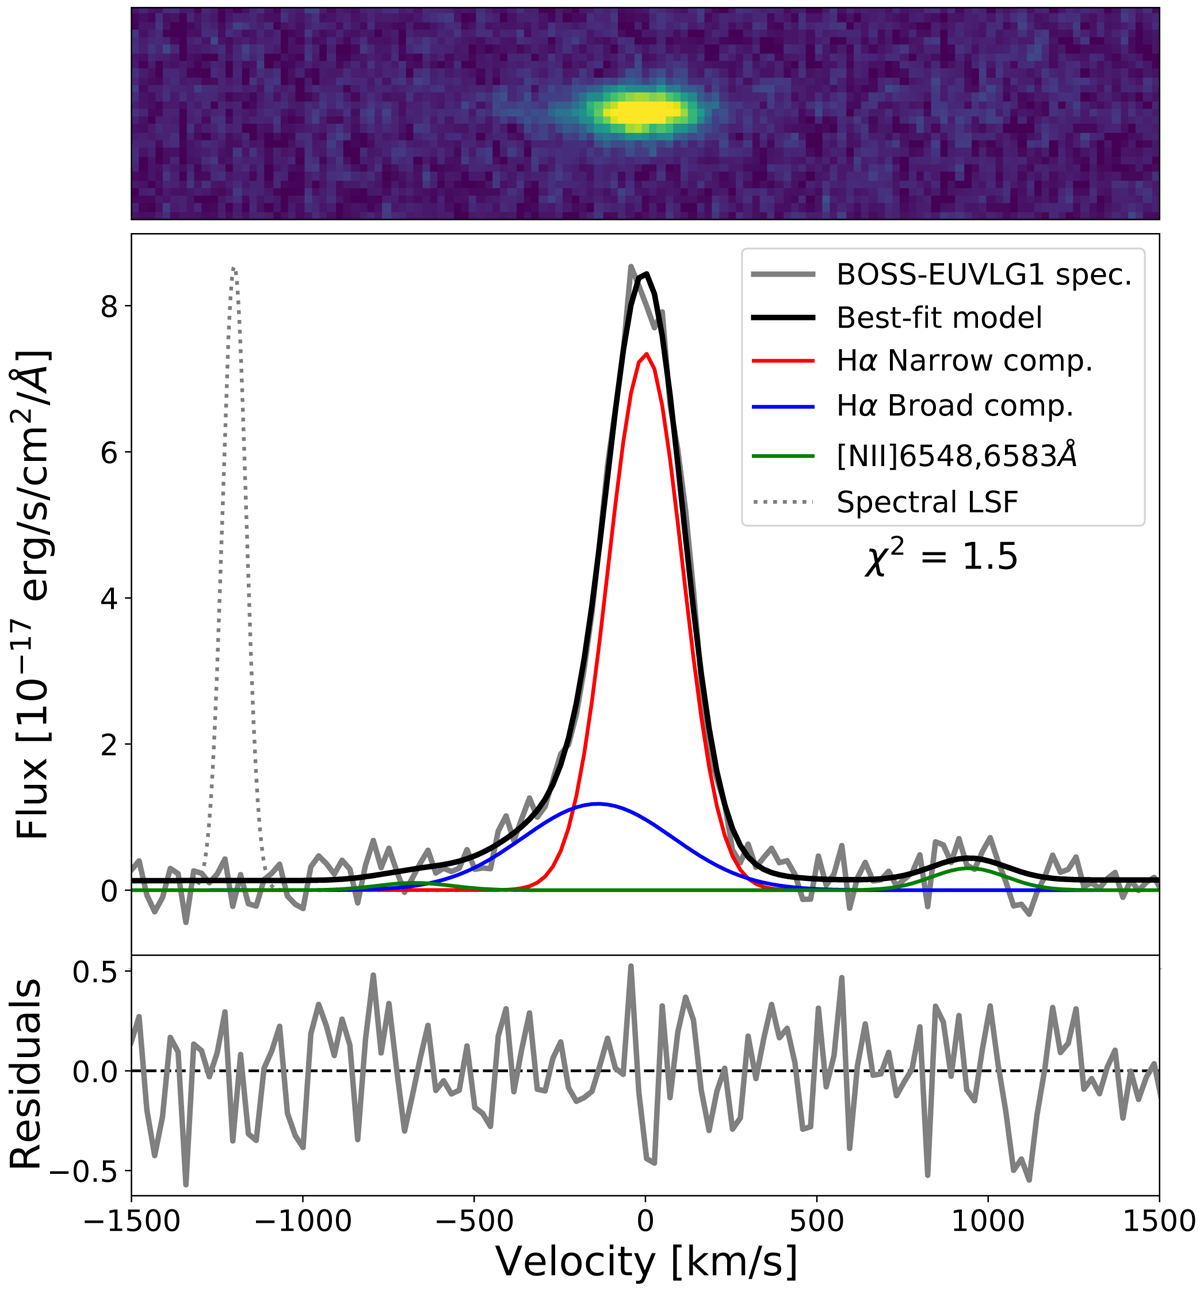
Observed Hα emission of BOSS-EUVLG1. Upper panel: near-IR 2D calibrated spectrum centered on the Hα emission. Bottom panel: observed Hα emission line profile of BOSS-EUVLG1, together with the two-components Gaussian fit and its residuals. Gray line: 1D observed Hα spectrum. Black line: best two-component Gaussian Hα fitted model. Red and blue lines: narrow and broad Hα components. Green line: [N II]6548,6583 Å lines. Gray dotted line: illustration of observed spectral line-spread function, derived from a sky line at 2.25 μm, normalized to the peak of the Hα emission, and centered within a velocity of −1200 km s−1. The χ2, calculated from −1000 to 750 km s−1, is also included.
Current usage metrics show cumulative count of Article Views (full-text article views including HTML views, PDF and ePub downloads, according to the available data) and Abstracts Views on Vision4Press platform.
Data correspond to usage on the plateform after 2015. The current usage metrics is available 48-96 hours after online publication and is updated daily on week days.
Initial download of the metrics may take a while.