Fig. 9.
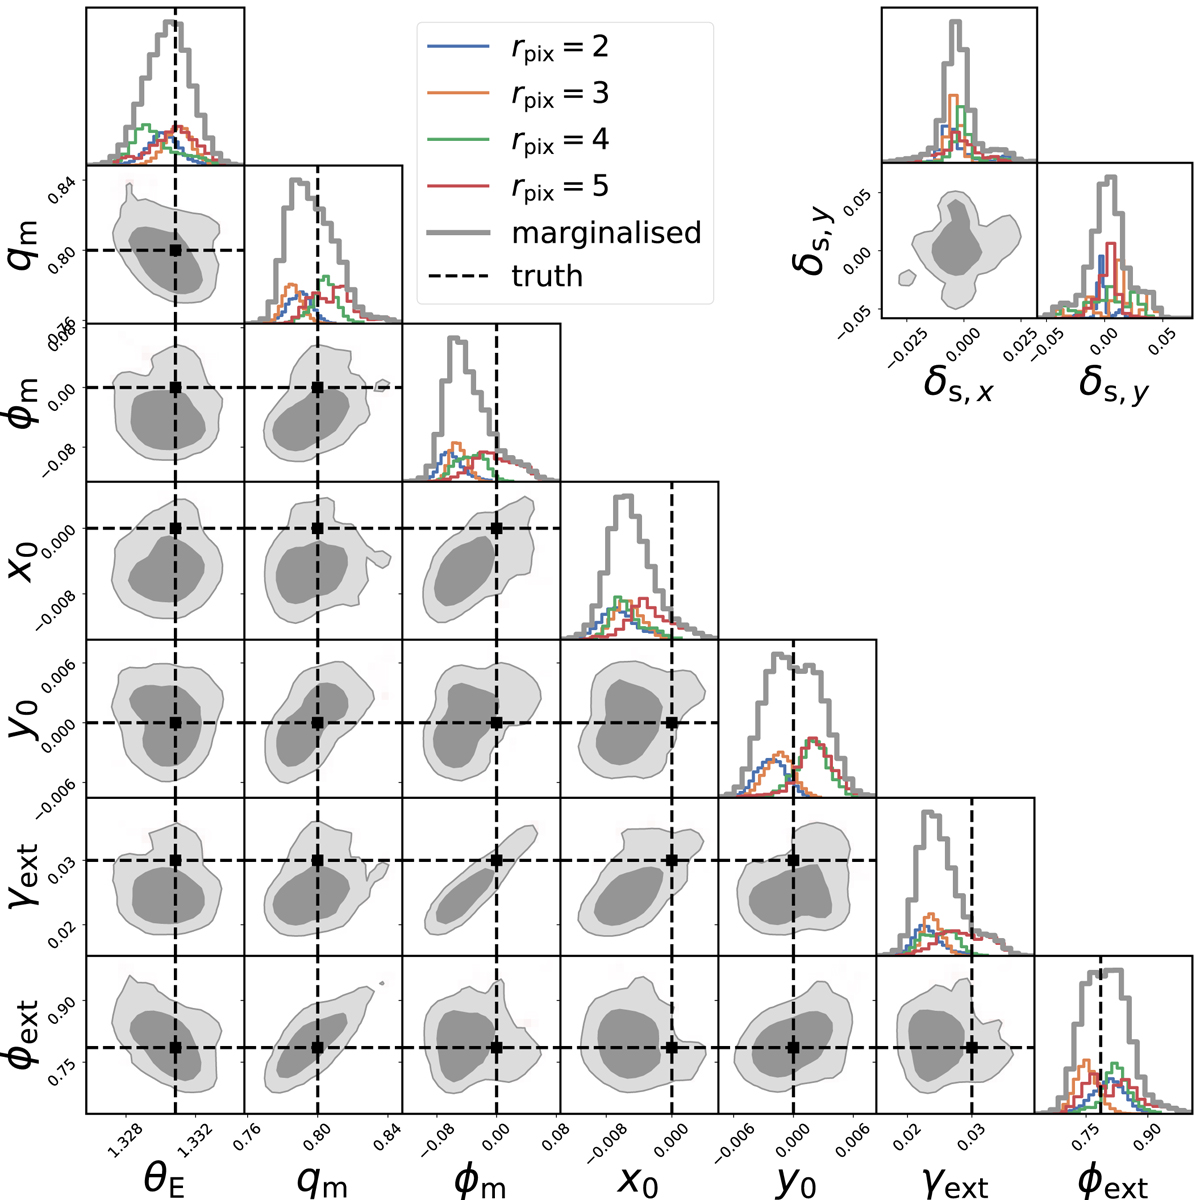
Posterior distributions for lens model (SIE + external shear) and source grid offset parameters (see Sect. 4.5 for details), for the simulated HST data shown in Fig. 4 (first row). We show individual posteriors for different values of rpix (thin colored contours), and the marginalised posteriors (thick grey contours) have been obtained by combination with equal weights. Two-dimensional contours show 68% and 95% of the distribution volume, and true values are indicated by dashed lines (https://github.com/aymgal/SLITronomy-papers/blob/master/paper_I/mass_sampling/corner_plot_mass_sampling.ipynb).
Current usage metrics show cumulative count of Article Views (full-text article views including HTML views, PDF and ePub downloads, according to the available data) and Abstracts Views on Vision4Press platform.
Data correspond to usage on the plateform after 2015. The current usage metrics is available 48-96 hours after online publication and is updated daily on week days.
Initial download of the metrics may take a while.