Fig. 6.
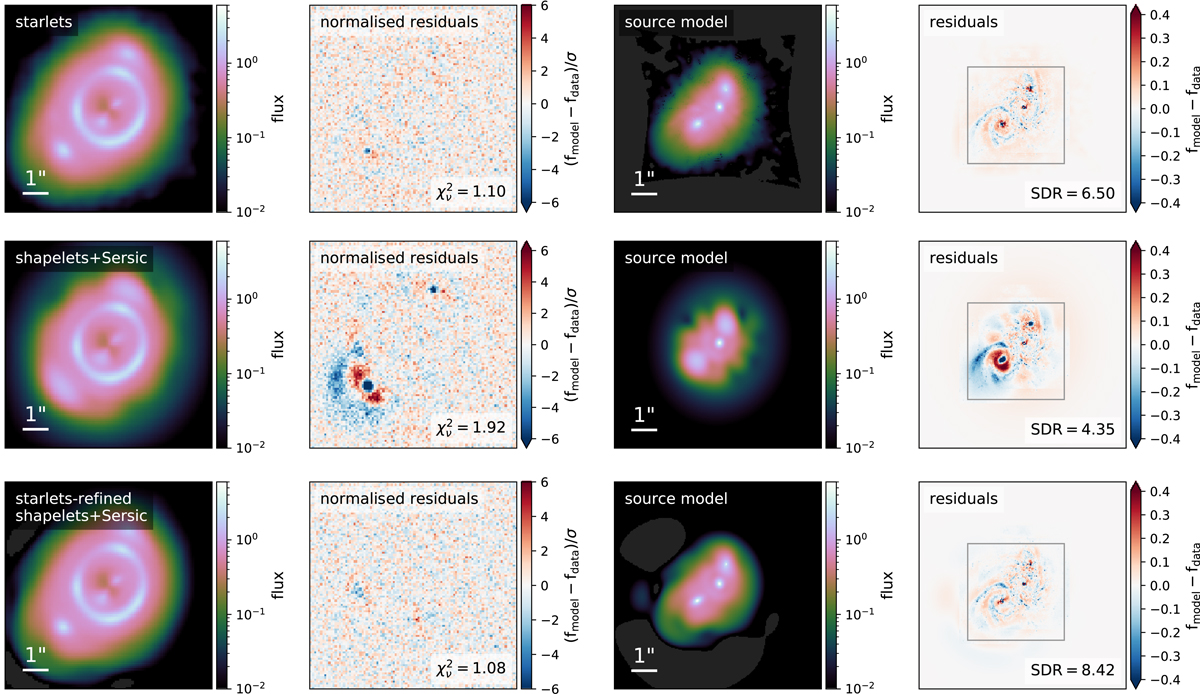
Source modelling of the simulated lensed galaxy group (bottom panel of Fig. 4). Top to bottom: sparse model with starlets (rpix = 3), analytical model shapelets+Sérsic (nmax = 8), and starlets-refined shapelets+Sérsic model (nmax = {3, 3, 9}). Left to right: image model, image normalised residuals and reduced chi-square, source model, source residuals and SDR. The SDR is computed only in the region indicated by the grey box. All source reconstructions are shown at the supersampled resolution corresponding to the chosen rpix. Dark grey areas in model panels correspond to non-positive pixel values (which can be negative with shapelets). We emphasise that the iterative refinement process, uses the model in first row to automatically setup the low-complexity model in second row, and further refine it until the reconstruction shown in last row (see Fig. 7 and Appendix B), https://github.com/aymgal/SLITronomy-papers/blob/master/paper_I/mock_source_reconstruction.ipynb.
Current usage metrics show cumulative count of Article Views (full-text article views including HTML views, PDF and ePub downloads, according to the available data) and Abstracts Views on Vision4Press platform.
Data correspond to usage on the plateform after 2015. The current usage metrics is available 48-96 hours after online publication and is updated daily on week days.
Initial download of the metrics may take a while.