Fig. 4.
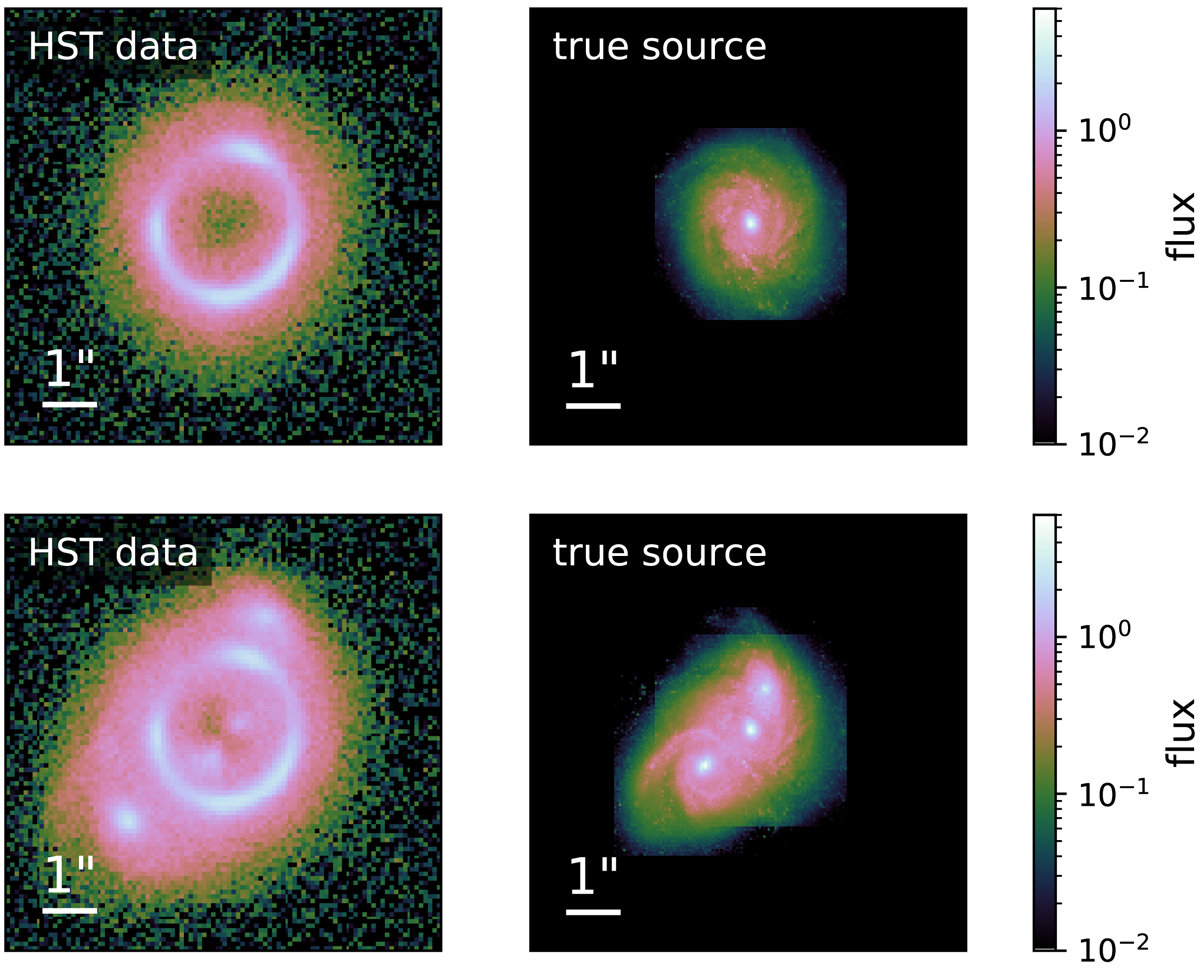
Simulated HST data. The lens light is assumed to be perfectly subtracted. The resolution and noise covariance mimic those of real observations with the WCF3/F160W instrument. First row: simulation using a single galaxy. Second row: more complex configuration with a composite of three close-by galaxies in the source plane. Source objects are projected on a finer grid, to match the resolution of our reconstruction technique (https://github.com/aymgal/SLITronomy-papers/blob/master/paper_I/mock_source_reconstruction.ipynb).
Current usage metrics show cumulative count of Article Views (full-text article views including HTML views, PDF and ePub downloads, according to the available data) and Abstracts Views on Vision4Press platform.
Data correspond to usage on the plateform after 2015. The current usage metrics is available 48-96 hours after online publication and is updated daily on week days.
Initial download of the metrics may take a while.