Fig. 12.
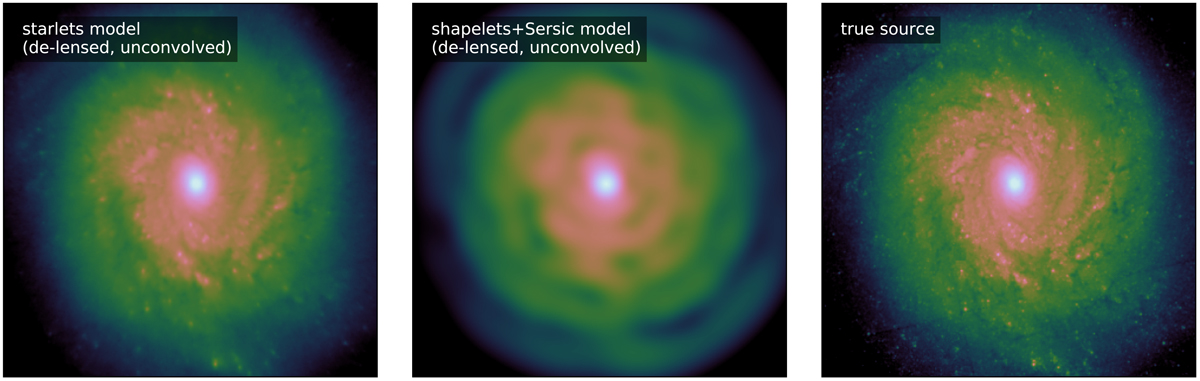
Zoom of the source reconstructions shown in Fig. 11, from the modelling of simulated E-ELT data. From left to right: source reconstruction with starlets (rpix = 2), source reconstruction with shapelets+Sérsic profile (nmax = 20), true source. We note that images are 2000 pixels on-a-side. The colour scaling is the same across to the panels. All source reconstructions are shown at the supersampled resolution corresponding to the chosen rpix (https://github.com/aymgal/SLITronomy-papers/blob/master/paper_I/mock_source_reconstruction.ipynb).
Current usage metrics show cumulative count of Article Views (full-text article views including HTML views, PDF and ePub downloads, according to the available data) and Abstracts Views on Vision4Press platform.
Data correspond to usage on the plateform after 2015. The current usage metrics is available 48-96 hours after online publication and is updated daily on week days.
Initial download of the metrics may take a while.