Fig. 1.
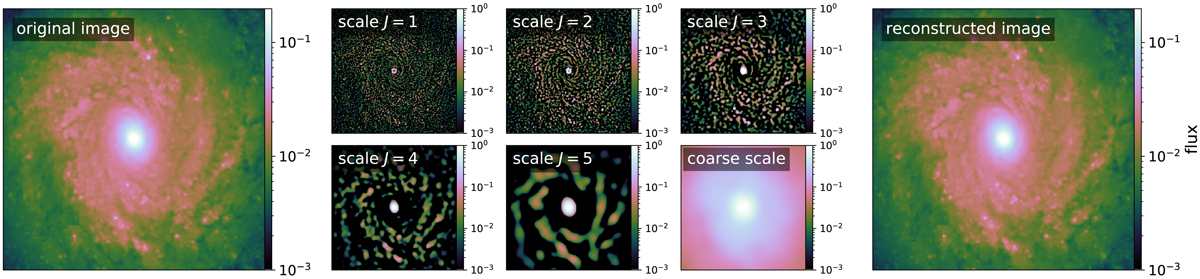
Multiscale decomposition using the starlet transform. Left panel: original image, similar to source galaxies in Sects. 5 and 6. Middle panels: scales of the starlet decomposition using 6 spatial scales, and normalised (max = 1) to enhance the contrast. In such a decomposition, a feature of a given scale is “brighter” in the corresponding image in the decomposition. Hence, keeping only highest pixels in each starlet scale filters out any insignificant signal over a large spectrum of spatial extents. All scale images have the same dimensions as the input image. Right panel: reconstructed image from all the decomposition scales, through co-addition of all decomposition scales. (https://github.com/aymgal/SLITronomy-papers/blob/master/paper_I/visualize_starlet_transform.ipynb.)
Current usage metrics show cumulative count of Article Views (full-text article views including HTML views, PDF and ePub downloads, according to the available data) and Abstracts Views on Vision4Press platform.
Data correspond to usage on the plateform after 2015. The current usage metrics is available 48-96 hours after online publication and is updated daily on week days.
Initial download of the metrics may take a while.