Fig. A.1.
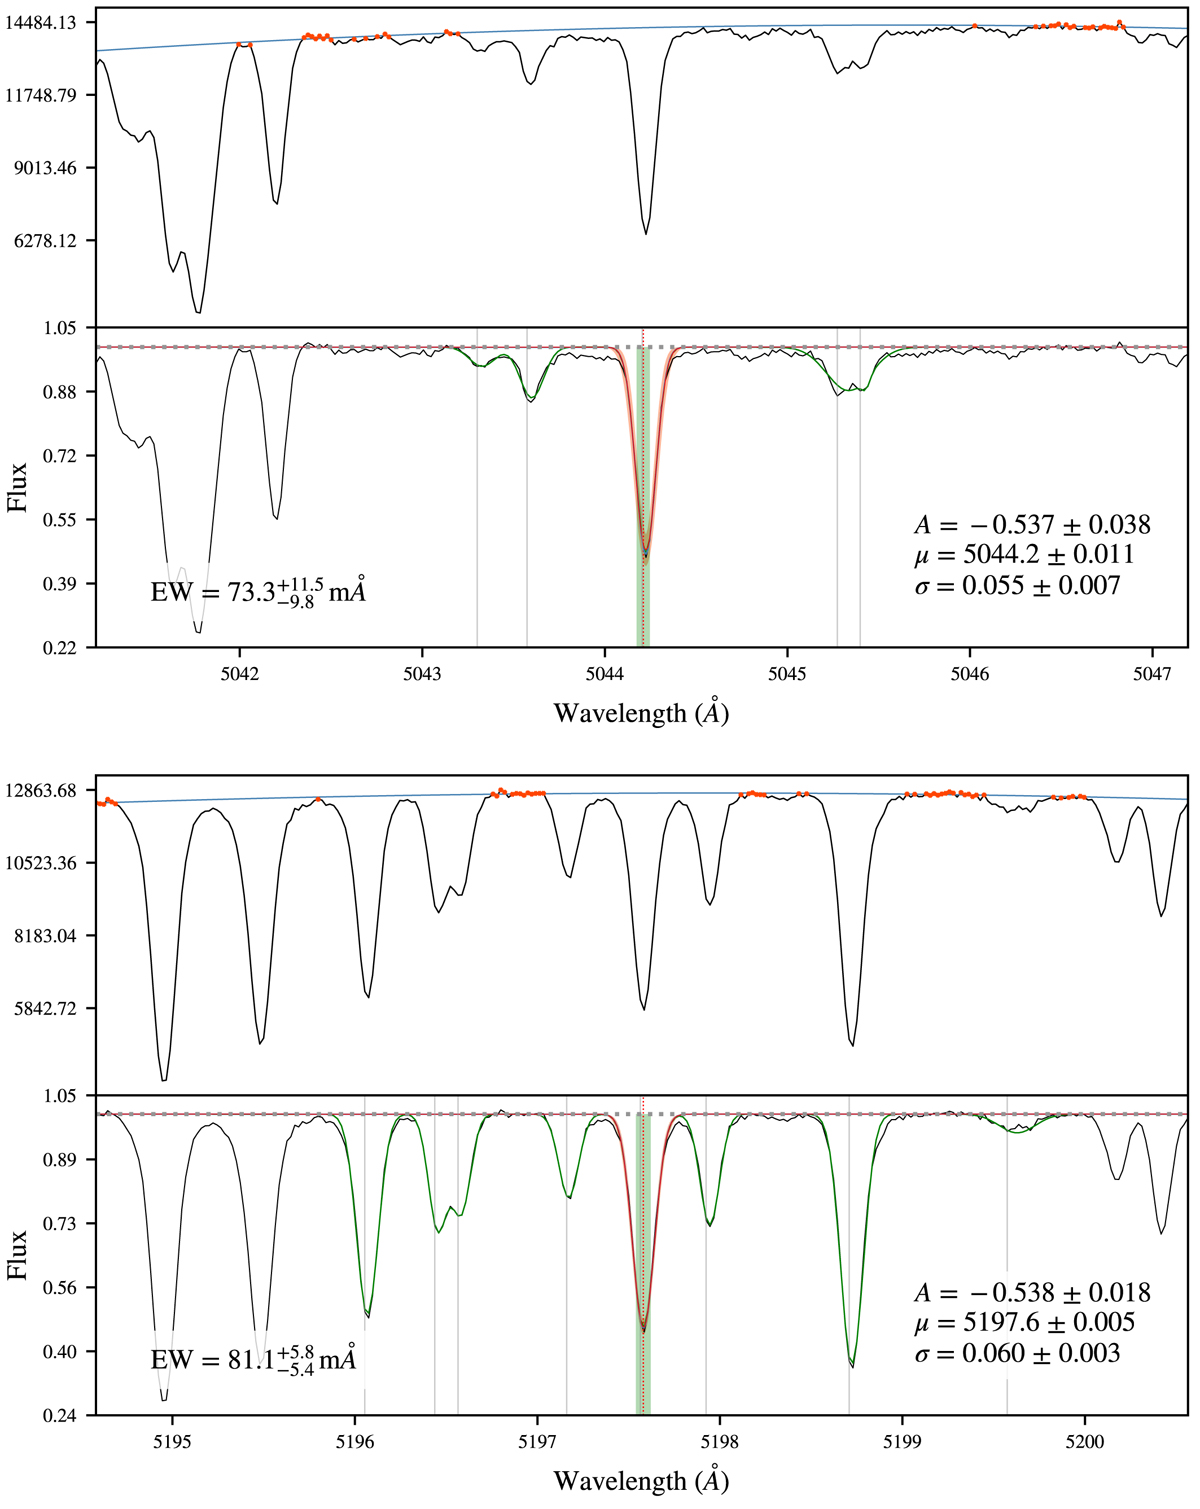
Fit performed to the Fe I 5044.21 Å and Fe II 5197.58 Å lines from one of the Sun spectra obtained by observing Ceres with HIRES. The top panels in both plots show the continuum fitting procedure, where the red dots are the final points selected for the fitting of the 2nd degree polynomial (blue line). Bottom panels: line fitting procedure. The gray lines are the absorption lines detected in the spectral range, and the green line the global fit to the data. The red region corresponds to the fit of the line l with its uncertainty, derived using the Gaussian parameters plus their uncertainties (quoted in the text). The green block represents the equivalent width.
Current usage metrics show cumulative count of Article Views (full-text article views including HTML views, PDF and ePub downloads, according to the available data) and Abstracts Views on Vision4Press platform.
Data correspond to usage on the plateform after 2015. The current usage metrics is available 48-96 hours after online publication and is updated daily on week days.
Initial download of the metrics may take a while.