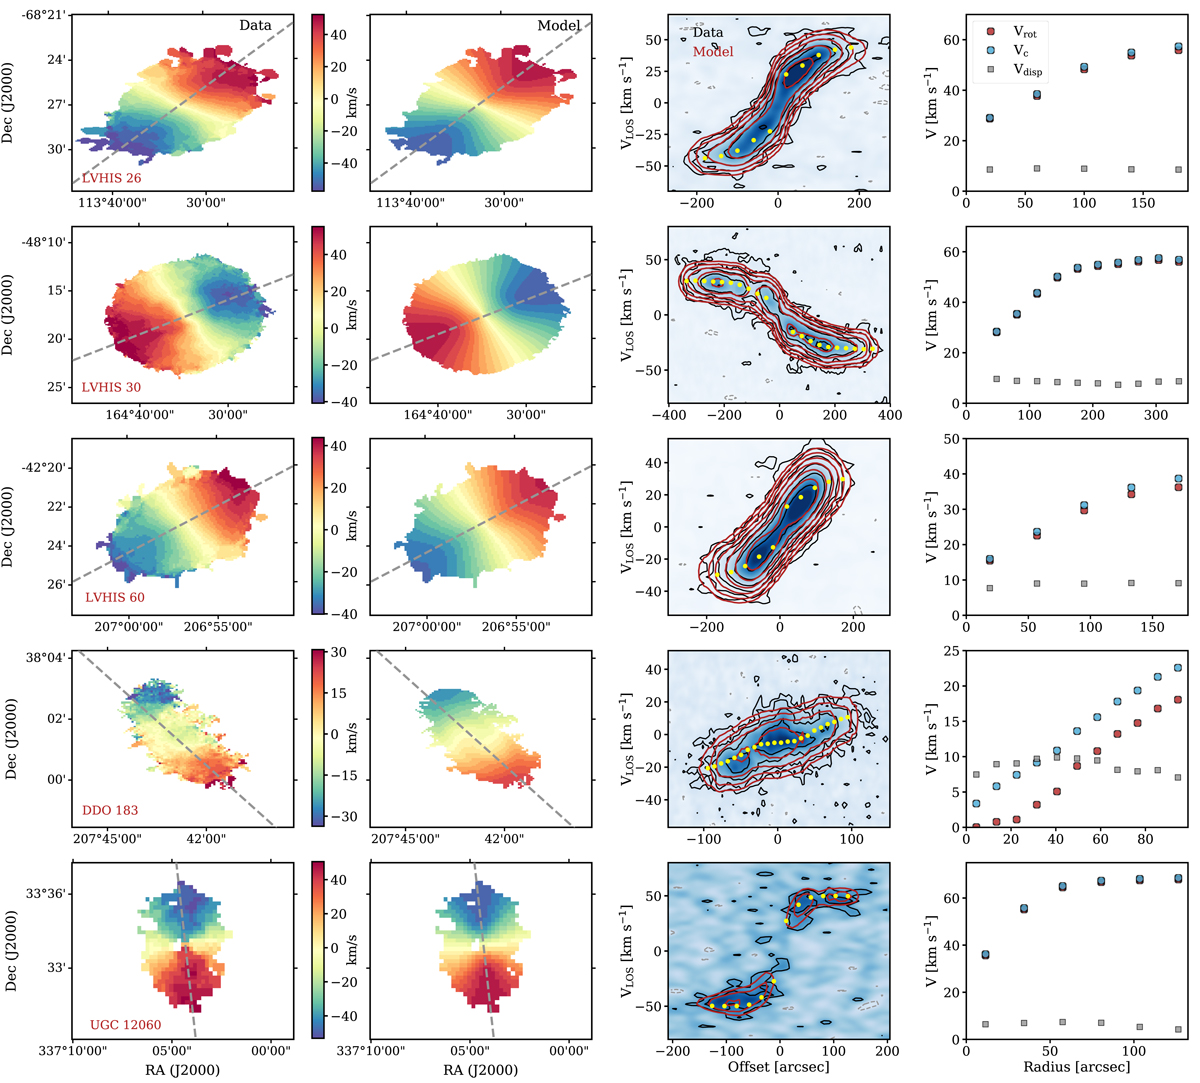
Fig. A.1.

Kinematic models of five representative galaxies obtained with 3D BAROLO. From left to right: (1) observed and (2) best-fitting model velocity field; the dashed grey line shows the average kinematic position angle, while the bar between the two panels show the colour scheme in both velocity fields. (3) Major axis position-velocity diagram: The data is shown in blue, while black contours enclose the data (grey for negative values) and red contours the best-fitting model. The contour levels are at −2, 2, 4, 8, 16, …times the mean rms in the corresponding data cube. The recovered rotation velocities are shown in yellow. (4) Rotation velocity (red), circular speed (blue) and velocity dispersion (grey) profiles.
Current usage metrics show cumulative count of Article Views (full-text article views including HTML views, PDF and ePub downloads, according to the available data) and Abstracts Views on Vision4Press platform.
Data correspond to usage on the plateform after 2015. The current usage metrics is available 48-96 hours after online publication and is updated daily on week days.
Initial download of the metrics may take a while.


