Fig. 5.
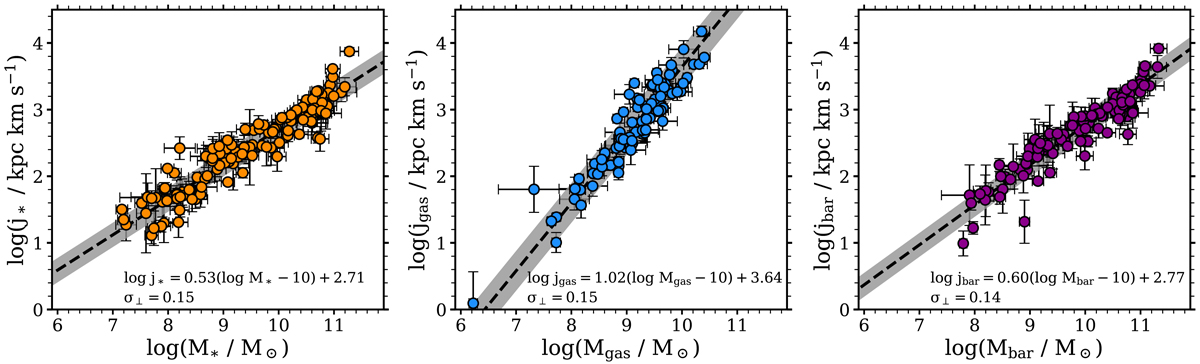
From left to right: stellar, gas, and baryonic j − M relations for our sample of galaxies. In all the panels the circles represent the observed galaxies, while the dashed black line and grey region show, respectively, the best-fitting relations and their perpendicular intrinsic scatter. The three relations are well fitted by unbroken power-laws: The best-fitting relations are shown for each panel (see Table 2). We remind the reader that each panel includes only the galaxies with convergent j*, jgas, and jbar profile, respectively, so the galaxies shown in one panel are not necessarily the same as in the other panels.
Current usage metrics show cumulative count of Article Views (full-text article views including HTML views, PDF and ePub downloads, according to the available data) and Abstracts Views on Vision4Press platform.
Data correspond to usage on the plateform after 2015. The current usage metrics is available 48-96 hours after online publication and is updated daily on week days.
Initial download of the metrics may take a while.